Sanctions and Slowdowns Impact Markets
- Sanctions on Russia are a two-way street
- COVID-related lockdowns slow Chinese economy
- SPR releases have noticeable effect on wholesale prices
- LNG imports to China reached 10.5 Bcf/d in 2021
By Alan Levine, Chairman, Powerhouse

The Matrix
The intricate connection between geopolitics and economics has rarely been demonstrated more clearly than recent weeks. Sanctions imposed to defeat Russia’s invasion of Ukraine are by no means a one-way street. If the EU chooses to turn away from Russian crude oil, coal, diesel and natural gas in a meaningful way, the increased energy costs their economies would face might well tip the Eurozone into recession. Actions that initially manifest in the form of higher energy prices might well morph into lower prices in future months as recession pulls down economic activity. Another economic feedback loop is at work in China. The country has entered Covid-related lockdowns in major cities and economic zones including Shanghai and Shenzhen. One international affairs consulting firm estimates the Shanghai lockdowns could reduce China’s overall crude oil consumption by up to 1.3 million barrels per day.
On March 31, the U.S. Administration announced the largest-ever release of oil from the Strategic Petroleum Reserve (SPR). The move was echoed by other member nations of the International Energy Agency (IEA) a few days later. In total, 1.3 million barrels per day will be released from reserves each day for the next six months. The effect on crude oil and refined products has been significant at the wholesale level. WTI and Brent crudes are down approximately 12%, RBOB is down roughly 9% and diesel prices have declined by over 14% since the announcement.
The next significant driver of refined products prices may well be the upcoming refinery maintenance season. Currently, U.S. refineries are running at nearly the highest level seen in the last five years. Market analysts expect turnarounds to be significant this Spring. A reduction of refinery output, especially diesel, at the present time would likely support prices as the still vibrant U.S. economy moves into a higher demand period.
Supply/Demand Balances
Supply/demand data in the United States for the week ended April 1, 2022 were released by the Energy Information Administration.
Total commercial stocks of petroleum rose 5.2 million barrels during the week ended April 1, 2022.
Commercial crude oil supplies in the United States increased by 2.4 million barrels from the previous report week to 412.4 million barrels.
Crude oil inventory changes by PAD District:
PADD 1: Down 0.9 million barrels to 7.0 million barrels
PADD 2: Plus 3.0 million barrels to 105.4 million barrels
PADD 3: Plus 2.2 million barrels to 227.7 million barrels
PADD 4: UNCH at 25.5 million barrels
PADD 5: Down 0.9 million barrels to 46.7 million barrels
Cushing, Oklahoma, inventories were plus 1.7 million barrels from the previous report week to 25.9 million barrels.
Domestic crude oil production was up 100,000 barrels per day from the previous report week to 11.7 million barrels daily.
Crude oil imports averaged 6.3 million barrels per day, a daily increase of 41,000 barrels. Exports increased 705,000 barrels daily to 3.693 million barrels per day.
Refineries used 92.5% of capacity; 0.4 percentage points higher from the previous report week.
Crude oil inputs to refineries increased 35,000 barrels daily; there were 15.948 million barrels per day of crude oil run to facilities. Gross inputs, which include blending stocks, rose 71,000 barrels daily to 16.529 million barrels daily.
Total petroleum product inventories rose 2.8 million barrels from the previous report week.
Gasoline million barrels stocks decreased 2.0 from the previous report week; total stocks are 236.8 million barrels.
Demand for gasoline rose by 63,000 barrels per day to 8.562 million barrels per day.
Total product demand decreased 59,000 barrels daily to 19.815 million barrels per day.
Distillate fuel oil stocks increased 0.8 million barrels from the previous report week; distillate stocks are at 114.3 million barrels. EIA reported national distillate demand at 3.647 million barrels per day during the report week, a decrease of 157,000 barrels daily.
Propane stocks increased 0.7 million barrels from the previous report week; propane stocks are at 34.4 million barrels. The report estimated current demand at 1.271 million barrels per day, a decrease of 130,000 barrels daily from the previous report week.
Natural Gas
The Department of Energy presented data on imports of natural gas by various countries. The chart shown below traces the experience of five such countries since 2006. Japan had been the largest importer of natural gas through this period until 2021. China’s burgeoning economy then required the most foreign gas for the first time. Once again, the geopolitics of energy have taken a dramatic turn.
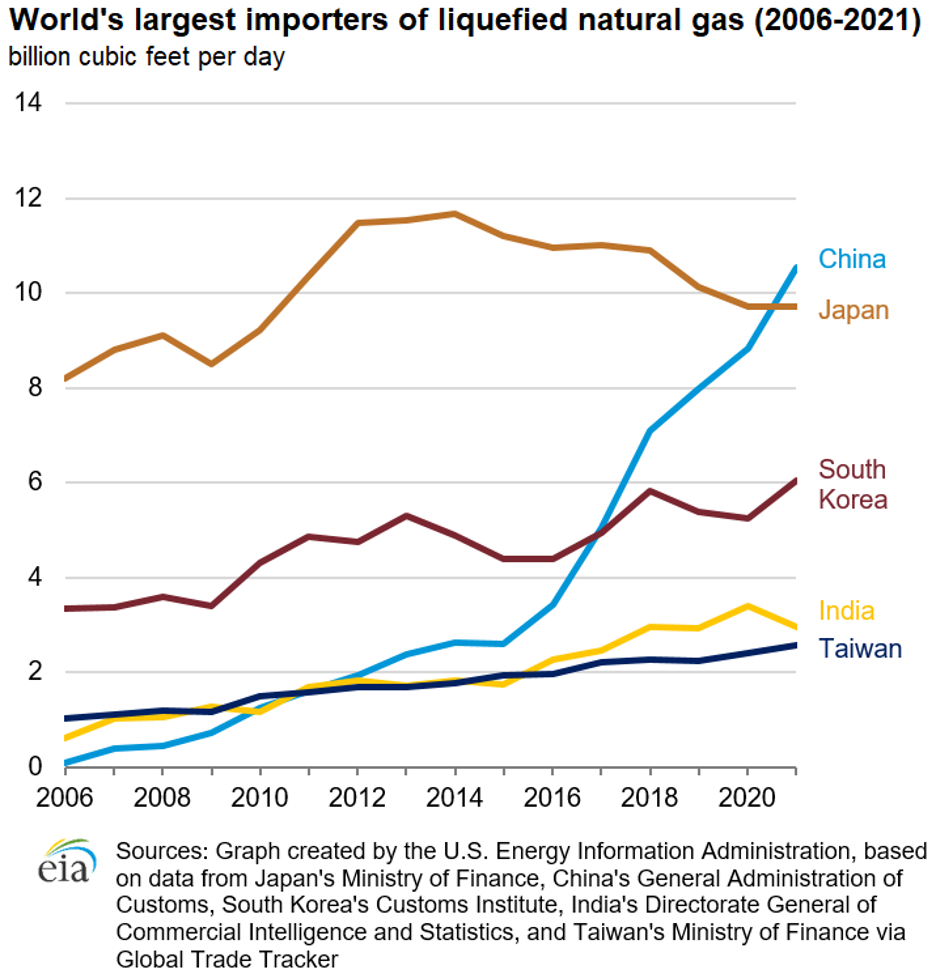
Leading Natural Gas Importer 2006 – 2021 Source: EIA
LNG imports to China reached 10.5 Bcf/d in 2021. This was a gain of 19% year-on-year, exceeding Japanese intake by 0.8 Bcf/d.
China relied on imports for nearly half of its 35.5 Bcf/d 2021 requirements. A bit more than 5.7 daily Bcf/d of those supplies came by pipeline from three of the neighboring “stans,” mostly Turkmenistan which provided 3.2 Bcf/d, Russia and Myanmar. Western sanctions on Russian energy — should they be imposed — would affect China not only in terms of crude oil but also natural gas, a much less fungible commodity.
According to the EIA:
The net withdrawals from storage totaled 33 Bcf for the week ended April 1, compared with the five-year (2017–2021) average net injections of 8 Bcf and last year’s net injections of 19 Bcf during the same week. Working natural gas stocks totaled 1,382 Bcf, which is 285 Bcf lower than the five-year average and 399 Bcf lower than last year at this time.
Was this helpful? We’d like your feedback.
Please respond to [email protected]
Powerhouse Futures & Trading Disclaimer
Copyright 2021 Powerhouse Brokerage, LLC, All rights reserved
POWERHOUSE, 3214 O St NW, Suite #2, Washington, DC 20007, United States, (202) 333-5380