Oil Prices Looking Higher
- Crude oil breaks higher
- Inventories slimming down
- Refinery use moves over 90% of capacity
- Natural gas storage is lagging

Alan Levine—Chairman, Powerhouse
(202) 333-5380
The Matrix
Petroleum futures prices continue to press higher. WTI spot crude oil futures have now made five new weekly highs since the middle of May, reaching a June monthly high of $74.25. The next WTI objective is around $77, last seen in November 2018.
Petroleum products’ price moves did not display the same intensity as did crude oil futures but set new weekly highs as well. RBOB reached $2.29 last week, with resistance at $2.50 (from October 2014). Diesel tried $2.19 and found next resistance around $2.26.
Price retracements have been hard to find in this long-trending move, and those price setbacks have been short and shallow.
Is the rally likely to continue? Inventories have been shrinking since early in the pandemic as refiners recovered from COVID-19 induced demand loss. And as economic recovery continues, pent-up demand has been enough to overcome the expansion of refinery use and support prices.
The Department of Energy’s balance sheet for the week ended June 18, 2021, showed four-week average refinery utilization at 91.2% of capacity. This was slightly higher than the prior week (+1.3 percentage points.)
Two years ago, refiners used 93.3% of operable capacity. (Utilization in 2020 (74.6%) was distorted by the U.S. being deep into COVID-19.) These robust utilization rates reflect the recovery of oil demand as the pandemic wanes.
Reducing inventories is bullish. So is OPEC+’s ability to reduce crude oil production following many years of relying on Saudi Arabia to hold output in check. Currently, OPEC+ is keeping to its goal of moderate growth for the near term, adding about 800,000 barrels to supply through July. One caution: OPEC+ is meeting on Thursday, July 1 to evaluate the market. A logical outcome could be adding production to satisfy strong demand.
Domestic crude oil production has been steady, providing 11.1 million barrels per day during the report week, well below the 13 million barrels daily production at its peak. Increased U.S. production may be inhibited as producers work to return funds to investors.
Technical analysis—using price charts and related statistics—point higher as well. Analysts are looking at an $80 price objective for WTI crude oil. The rapid onset of demand, however, has raised that goal to $100. Further, systems like Elliot Wave suggest the possibility of $175 per barrel as the next new top.
Supply/Demand Balances
Supply/demand data in the United States for the week ended June 18, 2021, were released by the Energy Information Administration.
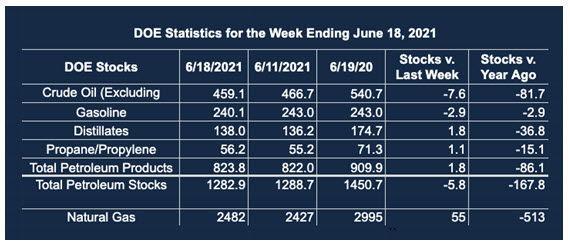
Total commercial stocks of petroleum fell 5.8 million barrels during the week ended June 18, 2021.
Commercial crude oil supplies in the United States decreased by 7.6 million barrels from the previous report week to 459.1 million barrels.
Crude oil inventory changes by PAD District:
PADD 1: Up 0.4 to 8.4 million barrels million
PADD 2: Down 2.1 million barrels to 127.5 barrels
PADD 3: Down 5.1 million barrels to 251.2 million barrels
PADD 4: Down 0.2 million barrels to 24.8 million barrels
PADD 5: Down 0.5 million barrels to 47.2 million barrels
Cushing, Oklahoma, inventories were down 1.9 million barrels from the previous report week to 41.7 million barrels.
Domestic crude oil production was down 0.1 million barrels per day from the previous report to 11.1 million barrels daily.
Crude oil imports averaged 6.943 million barrels per day, a daily increase of 197,000 barrels. Exports decreased 233,000 barrels daily to 3.651 million barrels per day.
Refineries used 92.2% of capacity; 0.4 percentage points lower from the previous report week.
Crude oil inputs to refineries decreased 225,000 barrels daily; there were 16.678 million barrels per day of crude oil run to facilities. Gross inputs, which include blending stocks, fell 64,000 barrels daily to 16.678 million barrels daily.
Total petroleum product inventories rose 1.8 million barrels from the previous report week.
Gasoline stocks decreased 2.9 million barrels from the previous report week; total stocks are 240.0 million barrels.
Demand for gasoline rose 80,000 barrels per day to 9.440 million barrels per day.
Total product demand increased 180,000 barrels daily to 20.751 million barrels per day.
Distillate fuel oil stocks rose 1.8 million barrels from the previous report week; distillate stocks are at 137.9 million barrels. EIA reported national distillate demand at 3.947 million barrels per day during the report week, a decrease of 389,000 barrels daily.
Propane stocks fell 1.0 million barrels from the previous report week to 56.2 million barrels. The report estimated current demand at 1.012 million barrels per day, an increase of 309,000 barrels daily from the previous report week.
Natural Gas
According to the EIA:
The net injections [of natural gas] into storage totaled 55 Bcf for the week ended June 18, compared with the five-year (2016–2020) average net injections of 83 Bcf and last year’s net injections of 115 Bcf during the same week. Working natural gas stocks totaled 2,482 Bcf, which is 154 Bcf lower than the five-year average and 513 Bcf lower than last year at this time.
The average rate of injections into storage is 15% lower than the five-year average so far in the refill season (April through October). If the rate of injections into storage matched the five-year average of 8.0 Bcf/d for the remainder of the refill season, the total inventory would be 3,565 Bcf on October 31, which is 154 Bcf lower than the five-year average of 3,719 Bcf for that time of year.
Was this helpful? We’d like your feedback.
Please respond to [email protected]
Powerhouse Futures & Trading Disclaimer
Copyright 2021 Powerhouse Brokerage, LLC, All rights reserved