Global Market Power Shifting From Traditional Players
- China gaining sway as a refining center
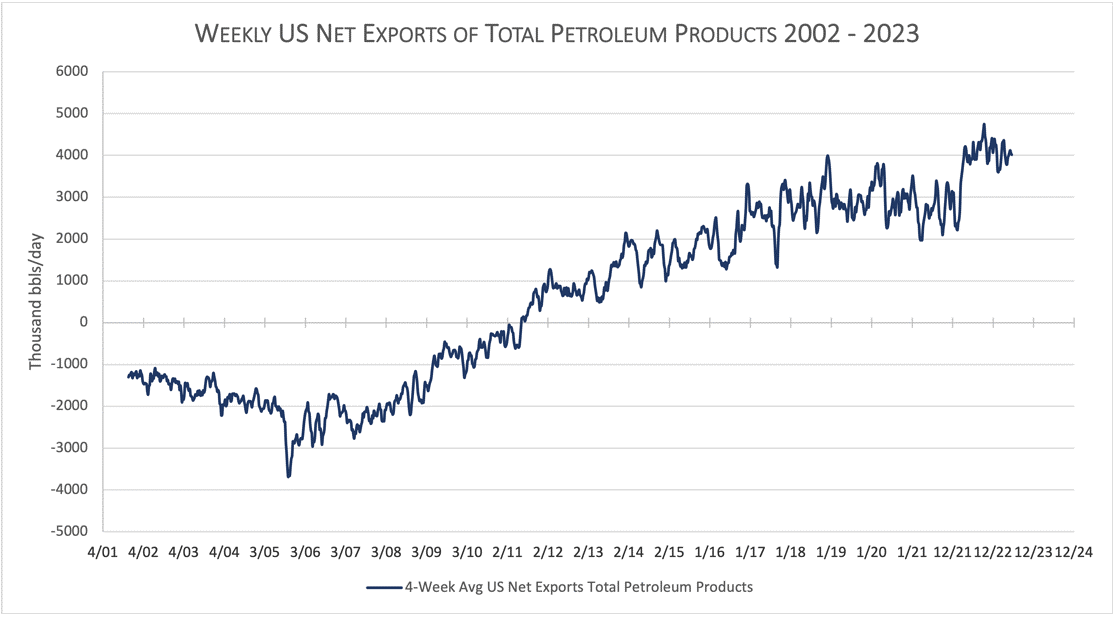
- United States becoming major product exporter
- Nigeria loses top spot as African crude oil producer
- Natural gas storage falls short
Sincerely,
Alan Levine, Chairman
Powerhouse
(202) 333-5380
The Matrix
Where petroleum comes from and where it goes influences global political relationships and ultimately prices and availability. Powerhouse examines three cases.
China
China may offer the best example of this in recent economic times. The country is developing enough refinery clout to make it a balance wheel for global product supply. “Since China began to open up and reform its economy in 1978, GDP growth has averaged almost 10% a year,” according to the World Bank.
The International Energy Agency has published an analysis suggesting that Asia, particularly China, will be the world’s engine of growth in petroleum until 2028. China is expected to add 1.5 million barrels of daily refining capacity to its capabilities. Processing volumes could rise to 16.5 million barrels daily. (The U.S. ran 16.6 million barrels daily of crude oil in its refineries for the week ended June 9, 2023.)
IEA expects refiners’ product exports to weigh heavily on forecasts of global product balances. This will especially impact diesel fuel, as will determinations of how much feedstock is to be diverted to petrochemicals.
China’s growing global importance comes with concern over the kind of economy it has. The country runs a command economy. There may be some elements of capitalism, but the government controls major decisions. And where decisions can be made by governmental objectives rather than by what global markets may require, uncertainty rules planning.
Increasing instability may be the result and price volatility a growing concern of reliance on China for new refining and products in global commerce.
The United States
The United States was a minor exporter of petroleum products in 2005, but since then has developed a major presence in global supply, exporting more than six million barrels per day in 2022. Outflows of distillates to Latin America and Europe are particularly important.
Another change in distribution has occurred in Nigeria. Nigeria has lost its place to Angola as Africa’s largest producer of crude oil. This change was probably inevitable as Nigeria has suffered for years from internal attacks on export facilities that often led to limits on exports.
A new petroleum law may help Nigeria regain a healthy oil industry. The national oil company has been restructured. Such entities are frequently barriers to growth and efficiency. They are often refuges for political cronies and patronage.
In 2019, the national oil company was not able to account for more than 107 million barrels of crude oil slated for domestic use. There was also a major discrepancy in the national oil company’s remittances to the national treasury that year.
Taxes and royalties on production have been lowered. Regulatory authorities have been split between upstream and mid- and downstream activities.
Supply/Demand Balances
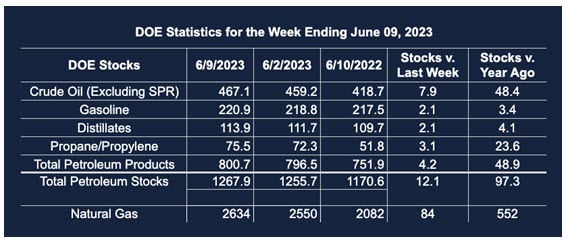
Supply/demand data in the United States for the week ended June 9, 2023, were released by the Energy Information Administration.
Total commercial stocks of petroleum rose (⬆) 12.1 million barrels to 1.2679 billion barrels during the week ended June 9, 2023.
Commercial crude oil supplies in the United States were higher (⬆) by 7.9 million barrels from the previous report week to 467.1 million barrels.
Crude oil inventory changes by PAD District:
PADD 1: Down (⬇) 0.1 million barrels at 7.7 million barrels
PADD 2: Up (⬆) 1.5 million barrels to 126.7 million barrels
PADD 3: Up (⬆) 6.1 million barrels to 254.3 million barrels
PADD 4: Unchanged (=) at 26.1 million barrels
PADD 5: Up (⬆) 0.4 million barrels to 52.3 million barrels
Cushing, Oklahoma, inventories were up (⬆) 1.7 million barrels from the previous report week to 42.1 million barrels.
Domestic crude oil production was unchanged (=) at 12.4 million barrels daily.
Crude oil imports averaged 6.381 million barrels per day, a daily decrease (⬇) of 19,000 barrels. Exports increased (⬆) 795,000 barrels daily to 3.270 million barrels per day.
Refineries used 93.7% of capacity; 2.1 percentage points lower (⬇) than the previous report week.
Crude oil inputs to refineries decreased (⬇) 61,000 barrels daily; there were 16.586 million barrels per day of crude oil run to facilities. Gross inputs, which include blending stocks, decreased (⬇) 165,000 barrels daily to 17.114 million barrels daily.
Total petroleum product inventories increased (⬆) by 4.3 million barrels from the previous report week, up to 800.8 million barrels.
Total product demand increased (⬆) 1.187 million barrels daily to 20.408 million barrels per day.
Gasoline stocks increased (⬆) 2.1 million barrels from the previous report week; total stocks are 220.9 million barrels.
Demand for gasoline decreased (⬇) 25,000 barrels per day to 9.193 million barrels per day.
Distillate fuel oil stocks increased (⬆) 2.1 million barrels from the previous report week; distillate stocks are at 113.9 million barrels. EIA reported national distillate demand at 3.574 million barrels per day during the report week, a decrease (⬇) of 239,000 barrels daily.
Propane stocks increased (⬆) by 3.1 million barrels from the previous report week to 75.5 million barrels. The report estimated current demand at 570,000 barrels per day, a decrease (⬇) of 350,000 barrels daily from the previous report week.
Natural Gas
Spot futures for Henry Hub natural gas reached a one-month high as the week of June 15, 2023 ended. The move higher came about because bullish information came available after several weeks of quiet trendless trading.
Oversold trading conditions at a time when a traditional rally before autumn added to the strength. Technical conditions, however, were not the major reason for the spike.
- The Energy Information Administration reported 84 Bcf added to underground storage for the week. This was well below industry expectations, which were 10 Bcf higher. The weather outlook turned very bullish at this time, with “scorching” temperatures in Texas and well-above normal temps in the Midwest. (Texas is the country’s largest natural gas consumer.)
Lower injections were themselves not important. Working gas in storage remains 27% higher than last year at this time. But demand for air conditioning with a challenged electric grid justifiably points to higher prices. - Regional European supply is slated to be cut this fall. The Dutch Groningen Field has supplied natural gas for 60 years to the continent. But earthquakes from production have harmed properties since the 1980’s. The closure opens the way for U.S. LNG exports to supply the EU which is looking for alternatives to Russian supplies.
- Lower-48 production of dry gas fell 0.6 Bcf/d during the report week. Net imports of Canadian natural gas fell modestly. Total supply tailed off by 0.6 Bcf/d too.
The rapid advance in price must raise the question of sustainability in view of the underlying storage position. Any weakness emerging in Europe could limit further strength, as could failure to take out the May high soon.
According to the EIA:
Natural gas injections into storage totaled 84 Bcf for the week ended June 9, equal to the five-year (2018–2022) average net injections of 84 Bcf and below last year’s net injections of 94 Bcf during the same week. Working natural gas stocks totaled 2,634 Bcf, which is 353 Bcf (15%) more than the five-year average and 552 Bcf (27%) more than last year at this time.
According to The Desk survey of natural gas analysts, estimates of the weekly net change to working natural gas stocks ranged from net injections of 77 Bcf to 101 Bcf, with a median estimate of 92 Bcf.
The average rate of injections into storage is 7% higher than the five-year average so far in the refill season (April 1 through October 31). If the rate of injections into storage matched the five-year average of 9.1 Bcf/d for the remainder of the refill season, the total inventory would be 3,948 Bcf on October 31, which is 353 Bcf higher than the five-year average of 3,595 Bcf for that time of year.
Was this helpful? We’d like your feedback.
Please respond to [email protected]
Powerhouse Futures & Trading Disclaimer
Copyright 2023 Powerhouse Brokerage, LLC, All rights reserved