By Dr. Nancy Yamaguchi
Introduction: Why fuel buyers and sellers should watch crude prices
Crude oil is the largest commodity in global trade, and oil prices are arguably the most intently watched prices in the world. For fuel buyers, however, there is a gulf between international crude prices and day-to-day prices for the diesel and gasoline they purchase. There are so many types of crude oil, and the ups and downs in crude prices do not have an immediate, one-for-one, impact on refined fuel prices. Why is it important to watch crude prices?
Oil traders, hedge fund managers, speculators and day traders follow crude prices and price differentials every minute of every day that markets are open. Fuel buyers and sellers may not follow crude prices as closely, but crude prices, more than any other single factor, determine product prices.
Crude oil prices are the largest component of refined fuel prices. The two infographics below were provided by the United States Energy Information Administration (EIA.) In October 2017, the fully built up retail price of regular gasoline was $2.51/gallon, 50% of which was the cost of crude. Refining costs accounted for 17% of the cost, distribution and marketing contributed 14% to the cost, and taxes added 19% to the cost.
The fully built up retail price of diesel was $2.79/gallon, 45% of which was the cost of crude. Refining accounted for 20% of the cost, distribution and marketing 16%, and taxes 19%.
Naturally, the closer the buyer is to the refiner (with prices set before taxes, distribution and marketing costs are added), the larger the share of crude oil is in the fuel price.
Source EIA

Source EIA
Therefore, while crude prices and product prices can diverge from day to day and from submarket to submarket, they cannot diverge too wildly and for too long. Imagine a swimmer swimming against the tide. It can be done, for a time, but less forward progress is made if the ocean is going the other way. If diesel prices are rising while crude prices are ebbing, eventually diesel prices will follow crude prices.
There are hundreds of crude oils traded, but two key crudes have emerged as the benchmarks for Trans-Atlantic pricing: West Texas Intermediate (WTI) in the U.S. and Brent Blend in Europe’s North Sea. Both are light (low in specific gravity) and sweet (low in sulfur) crudes. In terms of quality, WTI and Brent are relatively close. We may liken them to Trans-Atlantic cousins serving as benchmarks in their respective markets. Contracts for the purchase of many other crudes often are based on discounts or premia relative to these benchmark crudes.
The price gap, or differential, between WTI and Brent is closely watched as a barometer of Trans-Atlantic crude supply and demand. When WTI prices stray too far above Brent prices, this eventually stimulates movement of crude to the Americas. Conversely, having Brent prices too far above WTI prices stimulates movement of crude to Europe.
Both WTI and Brent prices impact U.S. fuel prices. The U.S. market is firmly tied to the global market, and despite the immense gains in U.S. crude production since the advent of the Shale Boom, the U.S. remains a net importer of crude oil. During the first three quarters of 2017, the U.S. imported 7.99 million barrels per day (MMbpd) of foreign crude, while exporting 0.96 MMbpd of crude to foreign destinations. To place this in context, the amount of crude imported by the U.S. is larger than the amount of oil consumed in all of the countries in South and Central America combined.
This article explores WTI and Brent crudes, their qualities and their price relationship. Crude prices have been moving dramatically, and the price differential between WTI and Brent has changed. These Trans-Atlantic cousins are re-examining their relationship.
History of the WTI-Brent Price Differential
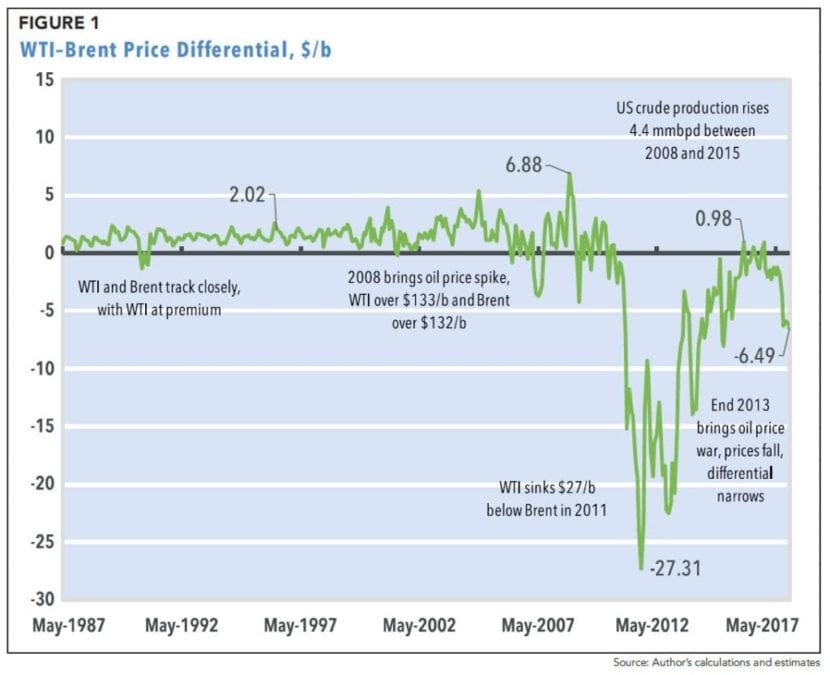
The international market has been accustomed to seeing WTI and Brent prices track one another closely, with WTI prices at a premium. The accompanying chart shows the WTI-Brent price differential calculated from monthly average spot prices as reported by the EIA. Between 1987 and 2004, the WTI-Brent price differential averaged around $1.50/b. Crude prices and the WTI-Brent relationship became much more volatile thereafter.
Crude prices climbed dramatically, and in 2008, WTI prices skyrocketed above $133/b while Brent prices went over $132/b. The Shale Boom was underway, and U.S. crude production rose by over 4.4 MMbpd between 2008 and 2015. The price spike was followed by a slump. Oversupply in the U.S. drove U.S. prices down relative to global prices, and the WTI-Brent differential went as low as -$27/b in 2011.
By the end of 2013, Saudi Arabia began to boost production to drive U.S. shale producers out of the market. The oil price war drove prices down, and the WTI-Brent differential narrowed.
WTI and Brent Crude Quality: A Gross Product Worth Comparison
During the years when WTI prices steadily surpassed Brent prices, it was commonly accepted that WTI was worth more because it was lighter and lower in sulfur. WTI crude is noted as having an American Petroleum Institute (API) gravity of 40.8 degrees and a sulfur content of 0.34% by weight. Brent Blend is noted at 40.1 API and 0.347% sulfur by weight. Crude qualities will vary over time, since the streams are blended, but WTI and Brent are quite close in quality according to these two simple measures. Individual refineries will place more or less value on them as feedstocks depending on a variety of factors, including their overall feedstock diet, their technology in place and the market they serve.
Two crudes with identical API gravities and sulfur contents may differ significantly in their attractiveness to a specific refinery. For example, the weight percent of the sulfur may be identical, but the sulfur levels in specific cuts of the crude may vary. Imagine that Crude A has an unusually high concentration of sulfur in its diesel-range material, while most of the sulfur in Crude B is locked into its heaviest vacuum residue. Most refineries striving to create essentially sulfur-free diesel would favor Crude B. As another example, imagine that Crude A and Crude B have the same API gravity, but Crude A provides a higher yield of vacuum gasoil to be used as feedstock for catalytic crackers and hydrocrackers, while Crude B has a higher yield of vacuum bottoms. Most sophisticated refineries would prefer Crude A.
As a simple example of crude value, consider this gross product worth, or GPW, buildup of WTI and Brent. This takes the percentage yields of the main streams upon atmospheric distillation and multiplies them by the value of the commodity. Three price cases are examined, devised by the author to be consistent with WTI and Brent spot prices in October 2017, which were reported by the EIA at $51.58/b and $57.51/b respectively ($1.23/gallon and $1.37/gallon.)

In price case #1, the GPW of both crudes is $1.31. Since WTI costs only $1.23/gallon, the net value, or profit, is $0.08. Since Brent costs $1.37/gallon, the net is negative $0.06. In other words, in this GPW approach, a gallon of WTI run through an atmospheric distillation tower will net a profit of $0.08, but running a gallon of Brent crude will lose $0.06.
In price case #2, a higher value is given to diesel and fuel oil, and Brent’s GPW rises to $1.32, and WTI’s GPW falls to $1.27. Still, the price premium given to Brent results in a negative GPW-Crude cost of $0.05, whereas WTI’s GPW of $1.27 is $0.04 above the crude cost of $1.23/gallon.
In price case #3, a higher value is given to naphtha and kerosene. Brent’s GPW decreases to $1.28, which is $0.09 less than the crude cost of $1.37/gallon. WTI’s GPW is $1.31, which is $0.08 above the crude cost of $1.23/gallon.
This is a simple approach, but it sheds light on how crude quality can affect refinery economics. More detailed refinery modeling would better capture the differences between Brent and WTI. For example, a refinery model could be built of a typical U.S. refinery using WTI crude to meet a U.S. pattern of refined product demand. A refinery model could be built of a typical European refinery running Brent crude to meet a European pattern of demand.
Still, the simple GPW approach suggests that the large price premium currently accorded to Brent crude is not warranted by its quality relative to WTI. The explanation must lie elsewhere. The following paragraphs discuss how the WTI-Brent price relationship has been affected by:
- The changes in the U.S. crude slate
- The change in the North American supply-demand balance versus the European and Eurasian supply-demand balance, and
- The internal logistics of crude transport in the U.S.
The Changing U.S. Crude Slate
As noted, light sweet crudes typically are more expensive than heavy sour crudes. In the U.S., the refining industry assiduously upgraded their facilities to accommodate a heavier, sourer crude slate. By adding technological sophistication, the cost of the crude feedstock could be reduced.
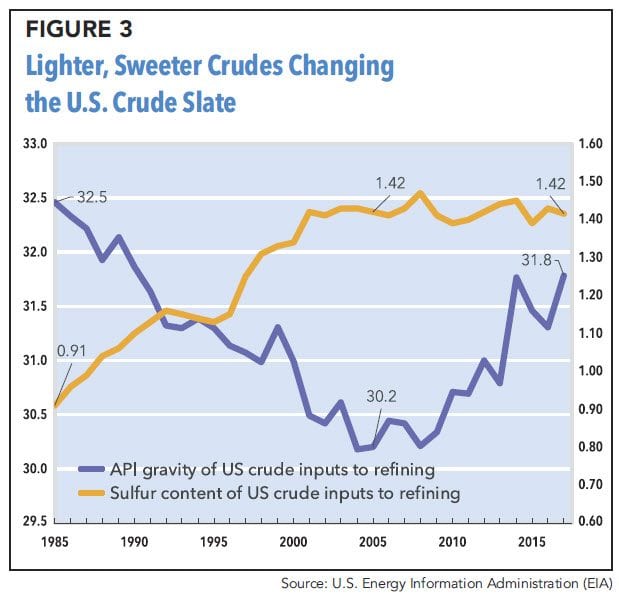
It was generally accepted that heavy sour crudes would remain abundant and cheap. In 1985, crude inputs to U.S. refining averaged 0.91% sulfur and 32.5 degrees API. The slate grew steadily heavier, and the API gravity declined to 30.2 degrees in 2004 and 2005. The sulfur content crept up to 1.42% by 2005. By this point, however, U.S. crude production was rising, and the new light tight oils (LTOs) from shale plays were changing the average crude slate. The sulfur content stopped climbing, and it has remained flattish between 2005 and 2017 (January – September average data). The downward trend in API gravity reversed, and it has risen to 31.8 degrees during the January – September 2017 period.
The influx of light, sweet crudes has changed the U.S. crude slate, and the value of light sweet crudes has diminished slightly relative to the heavy, sour crudes that U.S. refineries had geared up to use.
This article contains material appearing in Mansfield Energy’s FUELSNews360°, Q4 2017