
International Tensions Ease
- More Arab states recognize Israel
- Libya declares a cease-fire
- OPEC+ compliance spotty
- Natural gas futures prices are bullish

Alan Levine—Chairman, Powerhouse
(202) 333-5380
The Matrix
The oil industry has faced more than its share of international tension over many decades. An understanding of international alignments, realignments, and special arrangements among nations are central to an understanding of how access to oil impacts global events.
Conflict and animosity between Israel and many Arab states has been a barrier to regional peace for many years. The United Arab Emirates and Bahrain recognized Israel in recent weeks. These nations are in addition to Egypt and Jordan where recognition has been a fact for several decades.
Another normalization of diplomatic relations has now been signed with Sudan. Sudan will be removed from the list of state-sponsors of terrorism and will gain access to financial aid and investment from Israel. International loans will now be possible as well.
Another recent event with potentially bearish implications has occurred in Libya. A truce has been signed, characterized as a “permanent ceasefire agreement.” One immediate benefit would be ending an eight-month blockade of Libyan oil output, reviving state finances. The event has been met with skepticism, but it includes agreement on departure of foreign fighters.
If ultimately successful, this could heal political instability that has been present since 2011’s battles with Muammar Gaddafi. The country has been split between east and west since 2014. Production is now put at 500,000 barrels daily, far below Libya’s pre-civil war capacity of 1.6 million barrels daily.
The most significant uncertainty facing supply will be the performance of OPEC+. These nations, as a group, have largely met their objective of constrained production in support of price. The performance of individual members has been another story. Iraq and Nigeria, in particular, have overproduced their quotas. Moreover, if the Libyan situation holds, OPEC+ will have to determine how to incorporate its production into the group’s output.
Russia has recently imposed a new tax regime that creates disincentives to produce crude oil. This could contribute to lower production in support of the OPEC+ regime. The group’s production had been expected to rise next year, but resurging Covid-19 could inhibit demand and keep a lid on output.
Another challenge comes from the price of crude oil currently. WTI crude oil is priced around $40, a level attractive to U.S. shale oil producers, encouraging fresh output. There are also concerns about a new Covid-19 resurgence potentially cutting demand.
Supply/Demand Balances
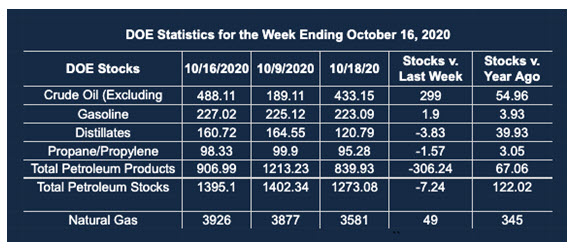
Supply/demand data in the United States for the week ending Oct. 16, 2020, were released by the Energy Information Administration.
Total commercial stocks of petroleum fell by 7.2 million barrels during the week ended Oct. 16, 2020.
Commercial crude oil supplies in the United States decreased by 1.0 million barrels from the previous report week to 488.1 million barrels.
Crude oil inventory changes by PAD District:
PADD 1: Down 1.6 million barrels to 10.3 million barrels
PADD 2: Plus 2.1 million barrels to 146.8 million barrels
PADD 3: Down 0.4 million barrels to 255.9 million barrels
PADD 4: Down 0.6 million barrels to 23.1 million barrels
PADD 5: Down 0.5 million barrels to 51.9 million barrels
Cushing, Oklahoma inventories were up 1.0 million barrels from the previous report week to 60.4 million barrels.
Domestic crude oil production fell 600,000 barrels per day to 9.9 million barrels daily.
Crude oil imports averaged 5.118 million barrels per day, a daily decrease of 167,000 barrels. Exports increased 901,000 barrels daily to 3.036 million barrels per day.
Refineries used 72.9% of capacity, down 2.2% from the previous report week.
Crude oil inputs to refineries decreased 551,000 barrels daily; there were 13.026 million barrels per day of crude oil run to facilities. Gross inputs, which include blending stocks, fell 403,000 barrels daily to reach 13.583 million barrels daily.
Total petroleum product inventories fell 6.2 million barrels from the previous report week.
Gasoline stocks decreased 1.6 million barrels daily from the previous report week; total stocks are 225.1 million barrels.
Demand for gasoline fell 287,000 barrels per day to 8.289 million barrels per day.
Total product demand decreased 1.363 million barrels daily to 18.112 million barrels per day.
Distillate fuel oil stocks decreased 3.8 million barrels from the previous report week; distillate stocks are at 160.7 million barrels. EIA reported national distillate demand at 3.588 million barrels per day during the report week, a decrease of 587,000 barrels daily.
Propane stocks decreased 1.6 million barrels from the previous report week; propane stocks are 98.3 million barrels. The report estimated current demand at 1.473 million barrels per day, an increase of 335,000 barrels daily from the previous report week.
Natural Gas
Natural gas price bulls point to declining stocks that reflect less drilling in this low-price environment. Moreover, total demand for natural gas has risen 8.3 percent week-on-week according to EIA’s most recent estimates. Another bullish factor has been increased LNG exports.
November futures need to terminate at a price of over $2.95 to sustain October’s bullish performance. Major resistance is found at $3.52. Bearish caution comes from substantial storage as the withdrawal season draws near.
According to the EIA:
The net [natural gas] injections into storage totaled 49 Bcf for the week ending October 16, compared with the five-year (2015–19) average net injections of 75 Bcf and last year’s net injections of 92 Bcf during the same week. Working natural gas stocks totaled 3,926 Bcf, which is 327 Bcf more than the five-year average and 345 Bcf more than last year at this time.
The average rate of injections into storage is 1% higher than the five-year average so far in the refill season (April through October). If the rate of injections into storage matched the five-year average of 8.2 Bcf/d for the remainder of the refill season, the total inventory would be 4,050 Bcf on October 31, which is 327 Bcf higher than the five-year average of 3,723 Bcf for that time of year.
Was this helpful? We’d like your feedback.
Please respond to [email protected]
Powerhouse Futures & Trading Disclaimer
Copyright 2020 Powerhouse Brokerage, LLC, All rights reserved