Expanding U.S. Production Can’t Hold Prices
- Crude oil output exceeds 10.6 million barrels daily
- West Texas crudes selling at steep discount
- U.S. oil stocks falling
- Gasoline demand stalls
- NGL demand rises
- Natural gas storage 900 Bcf below last year


The Matrix
WTI crude oil prices continue to hold recent highs despite bearish production statistics. In the week ended April 27, 2018, U.S. crude oil production breached 10.6 million barrels daily. Continuously advancing crude oil production has characterized the entire year. Crude oil output has risen in every week of 2018, adding more than 1.125 million barrels daily to supply this year.
A measure of the bearish supply picture may be found in the price of Texas crudes. Midland, Texas is a hub for pipelines that take regional crudes from the Permian Basin to Cushing, OK or to Gulf Coast refining centers. The flood of local crudes has overwhelmed offtake capacities and led to discounts of $13-$15 below the NYMEX screen.
At the same time, however, stocks of crude and products in the United States have fallen. Surpluses of 2017 are things of the past. Stocks have actually fallen modestly below their five-year average.
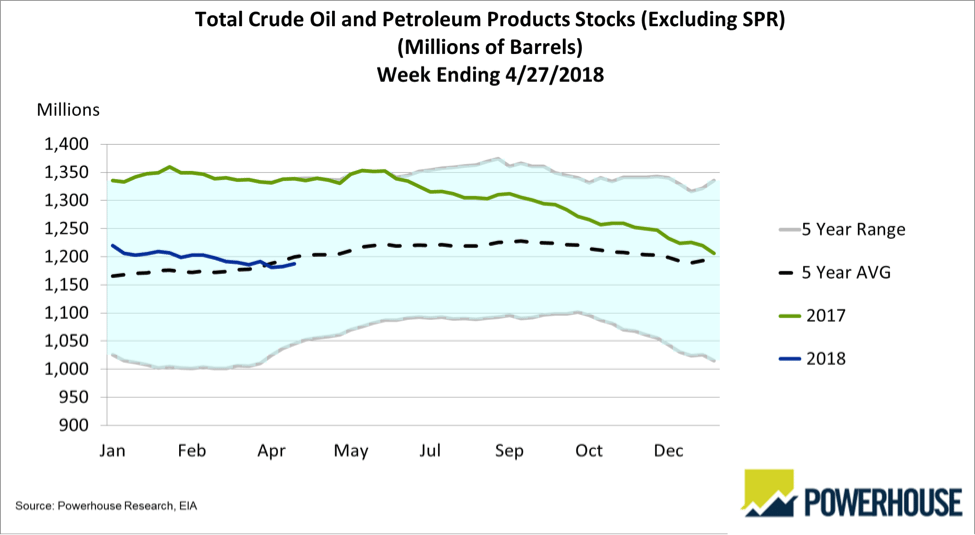
Crude and Products Stocks 2013-2018 Source: IEAMuch has been made of the growth in demand in petroleum in recent years, supporting the rise in oil prices. In fact, earlier this year, EIA recorded an increase in product demand of nearly 500,000 barrels daily. Traditionally, analysts would have looked at gasoline to explain the gains.
EIA’s chart of product supplied by type suggests something else is going on. Total petroleum demand (demand equals supply) has been moving higher. Monthly data for February (most recent data) show total demand of 19.6 million barrels per day. Comparable data for last year show a 2.4 per cent growth in the U.S.

Petroleum and Gasoline Supplied (million barrels/day) 1950-2017 Source: IEA
These same data show demand for “finished” products fell nearly 200,000 barrels daily. Gasoline accounted for nearly 90 per cent of the decline. The products included gasoline, diesel fuel and other products to a lesser extent.

Primary Energy Consumption (quadrillion btu) 1950-2017 Source: IEA
This left about 650,000 barrels daily, identified as “hydrocarbon gas liquids,” largely ethane and propane. This suggests a major shift in the demand for petroleum may be underway. Growth in natural gas yields additional NGLs for a receptive market.
Gasoline waits for the electric vehicle (EV.) EVs are still a miniscule share of the vehicle fleet. Several states have passed legislation encouraging the use of EVs. These include tax credits in the District of Colombia. Georgia has a zero emissions vehicle (ZEV) tax credit. California offers rebates and Washington state exempts EVs from sales and use taxes.
Will you be at the Eastern Energy Exbo (EEE)?
Please join Elaine Levin from POWERHOUSE as she discusses the issues that will drive the oil markets for the rest of the year.
What Happened to “Lower for Longer?”
Monday, May 21 from 5:00 PM – 6:00 PM
Bravo Room, Fox Tower, Foxwoods, CT
Attendance is free but space is limited. Register for your seat here
You also don’t want to miss POWERHOUSE CEO Alan Levine speak at EEE’s official education session:
Bulls vs. Bears – Two Oil Price Scenarios
Tuesday, May 22 from 11:15 AM – 12:15 PM
Grand D Room, Foxwoods, CT
Elaine and Alan will also be on the trade show floor at booth #629
Supply/Demand Balances
Supply/demand data in the United States for the week ending April 27, 2018 were released by the Energy Information Administration.
Total commercial stocks of petroleum rose 5.4 million barrels during the week ending April 27, 2018.
There were builds in stocks of gasoline, fuel ethanol, K-jet fuel, propane, and other oils. Draws were reported in stocks of distillates and residual fuel oil.
Commercial crude oil supplies in the United States increased to 436.0 million barrels, a build of 6.2 million barrels.
Crude oil supplies increased in three of the five PAD Districts. PAD District 1 (East Coast) crude oil stocks advanced 0.9 million barrels, PADD 3 (Gulf Coast) stocks rose 0.6 million barrels, and PADD 5 (West Coast) crude oil stocks increased 4.8 million barrels. PAD District 2 (Midwest) stocks were unchanged from the previous report week.
Cushing, Oklahoma inventories increased 0.4 million barrels from the previous report week to 35.8 million barrels.
Domestic crude oil production increased 33,000 barrels daily to 10.619 million barrels per day from the previous report week.
Crude oil imports averaged 8.549 million barrels per day, a daily increase of 80,000 barrels. Exports fell 183,000 barrels daily to 2.148 million barrels per day.
Refineries used 91.1 per cent of capacity, an increase of 0.3 percentage points from the previous report week.
Crude oil inputs to refineries decreased 60,000 barrels daily; there were 16.561 million barrels per day of crude oil run to facilities. Gross inputs, which include blending stocks, rose 45,000 barrels daily to 16.912 million barrels daily.
Total petroleum product inventories saw a decrease of 0.8 million barrels from the previous report week.
Gasoline stocks rose 1.2 million barrels from the previous report week; total stocks are 238.0 million barrels.
Demand for gasoline rose 8,000 barrels per day to 9.090 million barrels daily.
Total product demand increased 1.164 million barrels daily to 20.164 million barrels per day.
Distillate fuel oil supply declined 3.9 million barrels from the previous report week to 118.8 million barrels. National distillate demand was reported at 4.485 million barrels per day during the report week. This was a weekly increase of 736,000 barrels daily.
Propane stocks advanced 0.7 million barrels from the previous report week; propane stock are 36.4 million barrels. Current demand is estimated at 1.012 million barrels per day, an increase of 128,000 barrels daily from the previous report week.
Natural Gas
According to the Energy Information Administration:
Working gas storage begins refilling after an unprecedented series of April withdrawals. Net injections into storage totaled 62 Bcf for the week ending April 27, which is in line with the five-year (2013–17) average net injection of 69 Bcf and last year’s net injections of 68 Bcf during the same week. Unusually cold weather for most of April resulted in net withdrawals from storage for the first three weeks of the month.
In the weekly data EIA publishes in the Weekly Natural Gas Storage Report (WNGSR), which dates back to 1993, there have never been three consecutive April withdrawals. Partly as a result of the prolonged withdrawal season, working gas stocks ended the storage week at 1,281 Bcf, which is 527 Bcf lower than the five-year average and 897 Bcf lower than last year at this time.
Natural gas struggles to break out to new highs. At some point, analysts are saying, prices should move higher on the theory that the best cure for low prices is low prices. Conversion from coal-fired to natural gas-powered electricity seems attractive at current prices. As more gas is diverted, injections would be reduced, leading to higher prices.
Futures trading involves significant risk and is not suitable for everyone. Transactions in securities futures, commodity and index futures and options on future markets carry a high degree of risk. The amount of initial margin is small relative to the value of the futures contract, meaning that transactions are heavily “leveraged”. A relatively small market movement will have a proportionately larger impact on the funds you have deposited or will have to deposit: this may work against you as well as for you. You may sustain a total loss of initial margin funds and any additional funds deposited with the clearing firm to maintain your position. If the market moves against your position or margin levels are increased, you may be called upon to pay substantial additional funds on short notice to maintain your position. If you fail to comply with a request for additional funds within the time prescribed, your position may be liquidated at a loss and you will be liable for any resulting deficit. Past performance may not be indicative of future results. This is not an offer to invest in any investment program.
Powerhouse is a registered affiliate of Coquest, Inc.
Was this helpful? We’d like your feedback.
Please respond to [email protected]
Copyright © 2018 Powerhouse, All rights reserved