U.S. Quits Iran Nuclear Deal—Introducing Uncertainty
- America at odds with western allies
- Iran experienced at dealing with oil sanctions
- Crude oil price nears mid-$70’s objective
- Natural gas share of new generation grows in 2018

The Matrix
The United States is leaving the Joint Comprehensive Plan of Action (JCPOA) – the 2015 Iranian nuclear agreement. The rationale for U.S. action seems grounded in political considerations; the economic implications are complicated by uncertainty. At writing, it appears that other signatories intend to stay in the JCPOA. Other impacts cited by various market analysts include an expectation that Iranian supply would falter by up to “several hundred thousand” barrels per day.
At least one observer took a contrarian view, pointing out that even a loss of five hundred thousand barrels daily might not impact Iran seriously because higher prices could serve as an offset. “Most importantly, Iran learned how to work with sanctions and the country is in a much stronger position politically and economically to work with other major players in the region to find a solution which fits all.’
Oil prices reacted sharply. On Wednesday, following release of EIA’s petroleum balance sheet – itself bullish – WTI crude oil prices added more than two dollars to the futures’ price.
Where might prices go? As a practical matter, re-imposition of sanctions by the U.S. face a six-month winding-down period, easing impacts in the market. Saudi Arabia has indicated its willingness to replace lost Iranian exports. Moreover, OPEC’s current constraint may be tested more broadly after the group’s June meeting. Further OPEC output cuts are now off the table. The conversation will inevitably turn to when output should start to increase again.
Technical market analysis may provide another guide as to where prices might top.

WTI Crude Oil Futures Apr 2015 – May 2018 Source: NYMEX
WTI crude oil prices fell to a bottom around $26.05 during the first half of 2016. During its decline, prices attempted a rally which rose to roughly fifty dollars in October 2015. After bottoming, crude oil prices moved higher, reaching $49.50 in May of 2016 and covering a range of $23.50. Subsequently, prices moved into a long, low volatility range. Another rally, still in force, began in June, 2017.
If prices reach $73.20, they will have doubled the rally off the 2016 lows. Mid- ‘70’s prices have been seen in other technical analyses as well, including Powerhouse’s own Elliott Wave analysis.
Supply/Demand Balances
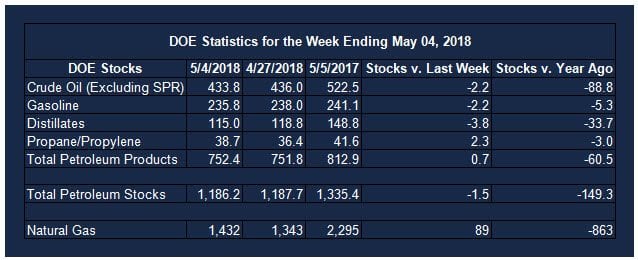
Supply/demand data in the United States for the week ending May 4, 2018 were released by the Energy Information Administration.
Total commercial stocks of petroleum fell 1.5 million barrels during the week ending May 4, 2018.
There were draws in stock of gasoline, fuel ethanol, and distillate fuel oil. Inventory builds were reported in stocks of K-jet fuel, propane, and other oils. Stocks of residual fuel oil were unchanged.
Commercial crude oil supplies in the United States decreased to 433.8 million barrels, a draw of 2.2 million barrels.
Crude oil supplies decreased in three of the five PAD Districts. PAD District 1 (East Coast) stocks fell 0.1 million barrels, PADD 3 (Gulf Coast) stocks declined 2.5 million barrels, and PADD 5 (West Coast) retreated 1.6 million barrels. PAD District 2 (Midwest) stocks rose 1.5 million barrels and PADD 4 (Rockies) stocks rose 0.6 million barrels.
Cushing, Oklahoma inventories increased 1.4 million barrels from the previous report week to 37.2 million barrels.
Domestic crude oil production increased 84,000 barrels daily to 10.703 million barrels per day from the previous report week.
Crude oil imports averaged 7.323 million barrels per day, a daily decrease of 1.226 million barrels per day. Exports fell 271,000 barrels daily to 1.877 million barrels per day.
Refineries used 90.4 per cent of capacity, a decrease of 0.7 percentage points from the previous report week.
Crude oil inputs to refineries decreased 75,000 barrels daily; there were 16.486 million barrels per day of crude oil run to facilities. Gross inputs, which include blending stocks, declined 120,000 barrels daily to 16.792 million barrels daily.
Total petroleum product inventories saw an increase of 0.7 million barrels from the previous report week.
Gasoline stocks fell 2.2 million barrels from the previous report week; total stocks are 235.8 million barrels.
Demand for gasoline rose 684,000 barrels per day to 9.775 million barrels daily.
Total product demand increased 384,000 barrels daily to 20.548 million barrels per day.
Distillate fuel oil supply declined 3.8 million barrels from the previous report week to 115.0 million barrels. National distillate demand was reported at 4.307 million barrels per day during the report week. This was a weekly decrease of 179,000 barrels daily.
Propane stocks advanced 2.3 million barrels from the previous report week; propane stock are 38.7 million barrels. Current demand is estimated at 977,000 barrels per day, a decrease of 34,000 barrels daily from the previous report week.
Natural Gas
According to the Energy Information Administration:
Working gas storage begins refilling after an unprecedented series of April withdrawals. Net injections into storage totaled 89 Bcf for the week ending May 4, compared with the five-year (2013–17) average net injection of 75 Bcf and last year’s net injections of 49 Bcf during the same week. Unusually cold weather for most of April resulted in net withdrawals from storage for the first three weeks of the month.
In EIA’s weekly data published in the Weekly Natural Gas Storage Report (WNGSR), which dates back to 1993, there have never been three consecutive April weekly withdrawals. Working gas stocks totaled 1,432 Bcf, which is 520 Bcf lower than the five-year average and 863 Bcf lower than last year at this time.
After several years during which renewable energy sources provided the bulk of new generation, natural gas may be finding a more important place at the table. EIA projects about 32 gigawatts of new power capacity in the United States in 2018. Of this, the EIA expects 21 GW from natural gas in 2018. This would reportedly be the first year since 2013 during which renewables would not contribute a majority of added capacity.
Futures trading involves significant risk and is not suitable for everyone. Transactions in securities futures, commodity and index futures and options on future markets carry a high degree of risk. The amount of initial margin is small relative to the value of the futures contract, meaning that transactions are heavily “leveraged”. A relatively small market movement will have a proportionately larger impact on the funds you have deposited or will have to deposit: this may work against you as well as for you. You may sustain a total loss of initial margin funds and any additional funds deposited with the clearing firm to maintain your position. If the market moves against your position or margin levels are increased, you may be called upon to pay substantial additional funds on short notice to maintain your position. If you fail to comply with a request for additional funds within the time prescribed, your position may be liquidated at a loss and you will be liable for any resulting deficit. Past performance may not be indicative of future results. This is not an offer to invest in any investment program.
Powerhouse is a registered affiliate of Coquest, Inc.
Was this helpful? We’d like your feedback.
Please respond to [email protected]
Copyright © 2018 Powerhouse, All rights reserved.