Oil Export Expectations Contradictory
- U.S. asks for expanding OPEC production
- Request coincides with Iranian sanctions
- Trade talks on expanding U.S. crude sales to China
- Natural gas injections fall below their 5-year average

The Matrix
The question of where U.S. crude oil might be used has been complicated by recent actions of the government. Oil exports to China have expanded dramatically while the Trump administration has reportedly asked some OPEC producers to add about one million barrels daily to supply.
The request for more output comes at a time when retail gasoline prices in the U.S. have reached recent highs. It also coincided with the U.S. decision to impose new sanctions on Iran.
Nonetheless, domestic crude oil is trading at a substantial discount to global stocks. Brent crude oil futures lost about 1.5 per cent after the report of the U.S. request was made public.
OPEC’s success at constraining crude oil production came about in part because it occurred at a time when Venezuela’s oil industry has been under extreme pressure. Ironically, the request also came at a time when global inventories had returned to their five-year average. In any event it seems likely that participants Saudi Arabia and Russia would be increasing output again. An OPEC meeting set for late June might ratify such an increase.
China’s take of U.S. oil came to one of every 21 barrels of U.S. crude oil produced in October, 2017 according to EIA. And while more recent data show a modest decline in in Chinese take, the country is likely to be a major user of American crude oil for years to come. One uncertainty comes from U.S. threats of imposing substantial tariffs on imports from China despite recent talks focused on expanding petroleum trade.

Beyond specific trade deals, the growth of U.S. exports has been record-making. The Census Bureau reported that crude oil exports reached 1.76 million barrels daily in April, up from 1.67 million barrels per day in March. This was the highest level of exports since at least 1920 according to government data.
Supply/Demand Balances
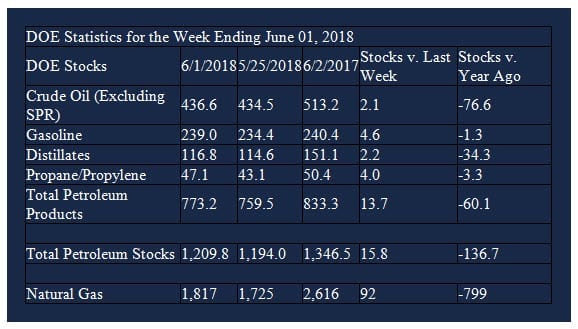
Supply/demand data in the United States for the week ending June 1, 2018 were released by the Energy Information Administration.
Total commercial stocks of petroleum rose 15.8 million barrels during the week ending June 1, 2018.
There were builds in stocks of gasoline, fuel ethanol, K-jet fuel, distillate fuel oil, propane, and other oils. There was a draw reported in stocks of residual fuel oil.
Commercial crude oil supplies in the United States increased to 436.6 million barrels, a build of 2.1 million barrels.
Crude oil supplies increased in two of the five PAD Districts. PAD District 3 (Gulf Coast) crude oils stocks rose 1.2 million barrels and PADD 5 (West Coast) stocks grew 2.5 million barrels. PADD 2 (Midwest) stocks declined 1.4 million barrels and PADD 4 (Rockies) stocks fell 0.3 million barrels. PADD 1 (East Coast) stocks were unchanged from the previous report week.
Cushing, Oklahoma inventories decreased 0.9 million barrels from the previous report week to 34.6 million barrels.
Domestic crude oil production increased 31,000 barrels daily to 10.800 million barrels per day from the previous report week.
Crude oil imports averaged 8.346 million barrels per day, a daily increase of 715,000 barrels per day. Exports declined 465,000 barrels daily to 1.714 million barrels per day.
Refineries used 95.4 per cent of capacity, an increase of 1.5 percentage points from the previous report week.
Crude oil inputs to refineries increased 214,000 barrels daily; there were 17.369 million barrels per day of crude oil run to facilities. Gross inputs, which include blending stocks, rose 271,000 barrels daily to 17.707 million barrels daily.
Total petroleum product inventories saw an increase of 13.7 million barrels from the previous report week.
Gasoline stocks rose 4.6 million barrels from the previous report week; total stocks are 239.0 million barrels.
Demand for gasoline fell 713,000 barrels per day to 8.976 million barrels per day.
Total product demand decreased 2.432 million barrels daily to 18.456 million barrels per day.
Distillate fuel oil supply increased 2.2 million barrels from the previous report week to 116.8 million barrels. National distillate demand was reported at 3.502 million barrels per day during the report week. This was a weekly decrease of 818,000 barrels daily.
Propane stocks rose 4.0 million barrels from the previous report week; propane stock are 47.1 million barrels. Current demand is estimated at 642,000 barrels per day, a decrease of 326,000 barrels daily from the previous report week.
Natural Gas
According to the Energy Information Administration:
Net injections fell to lower than the five-year average. Net injections into storage totaled 92 Bcf for the week ending June 1, lower than both the five-year (2013–17) average net injections of 104 Bcf and last year’s net injections of 103 Bcf during the same week.
Net injections averaged 13.7 Bcf/d; net injections will have to average 12.6 Bcf/d for the remainder of the refill season to match the five-year average level (3,815 Bcf) by October 31. Working gas stocks totaled 1,817 Bcf, which is 512 Bcf lower than the five-year average and 799 Bcf lower than last year at this time.
Analysts offered a variety of opinions on the prospects for natural gas pricing. One observer suggested that prices are building a floor around $2.95, looking eventually to top $3.00. More bearish attitudes were expressed by others that thin Cooling Degree Days could inhibit demand and push prices lower.
Futures trading involves significant risk and is not suitable for everyone. Transactions in securities futures, commodity and index futures and options on future markets carry a high degree of risk. The amount of initial margin is small relative to the value of the futures contract, meaning that transactions are heavily “leveraged”. A relatively small market movement will have a proportionately larger impact on the funds you have deposited or will have to deposit: this may work against you as well as for you. You may sustain a total loss of initial margin funds and any additional funds deposited with the clearing firm to maintain your position. If the market moves against your position or margin levels are increased, you may be called upon to pay substantial additional funds on short notice to maintain your position. If you fail to comply with a request for additional funds within the time prescribed, your position may be liquidated at a loss and you will be liable for any resulting deficit. Past performance may not be indicative of future results. This is not an offer to invest in any investment program.
Powerhouse is a registered affiliate of Coquest, Inc.
Was this helpful? We’d like your feedback.
Please respond to [email protected]
Copyright © 2018 Powerhouse, All rights reserved.