Oil Prices Shrug Off the Start of U.S. Trade War with China
- Strong global demand and supply disruptions favor the bull case
- U.S. trade war not affecting oil prices yet
- Saudi Aramco IPO in doubt
- A better than expected 78 Bcf natural gas storage injection is slightly bearish

The Matrix
Petroleum prices have been the subject of a lot of hyperbole on the state of both supply and demand. Nonetheless, the underlying reality appears to favor the bull case. This is based on generally strong global demand, a series of disruptions to supply and reducing stocks of crude oil. Very intense pressure by the United States to reduce Iranian exports adds to price strength.
Bearish considerations, including weaker demand in emerging markets, the prospects of a trade war and the apparent end of OPEC restraint on crude oil production do not appear to have moved the dial significantly toward lower prices.
Questions have been raised about the viability of Saudi Arabia’s plan to offer public shares of Aramco. Should the offering be cancelled, Saudi need for a higher price in support of the IPO would disappear, losing one reason for higher prices.
And rumors, including one that had Saudi Arabia agreeing to add up to two million barrels daily to supply, have contributed to broad intraday swings in price. (This story has since been disavowed.) Some analysts have reevaluated their estimates of crude oil output potential. In particular, they conclude that Iran, Libya and Angola are likely to struggle to achieve higher output. And Libya faces continued political pressure. This has impacted operations at export facilities in the eastern part of the country. Exports are now thought likely to fall to one-half million barrels daily during the third quarter. Angola has similar exports concerns, cutting into its contribution to global crude oil availability.
More supply is likely to come from Saudi Arabia’s spare capacity. On balance, however, analysts expect the rest of 2018 to be undersupplied by around 500,000 barrels daily. Higher prices are the obvious result of this situation.
Supply/Demand Balances
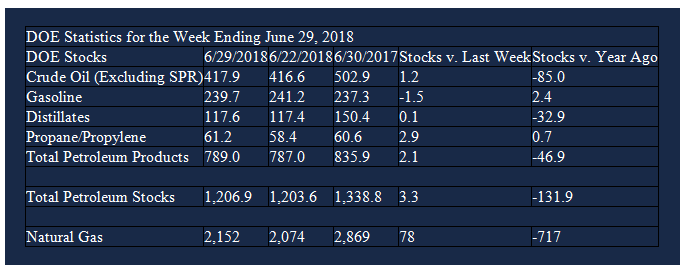
Supply/demand data in the United States for the week ending June 29, 2018 were released by the Energy Information Administration.
Total commercial stocks of petroleum rose 1.2 million barrels during the week ending June 29, 2018.
There were builds in stocks of fuel ethanol, distillates, propane, and other oils. There were draws in stocks of gasoline, K-jet fuel, and residual fuel.
Commercial crude oil supplies in the United States increased to 417.9 million barrels, a build of 1.2 million barrels.
Crude oil supplies decreased in four of the five PAD Districts. PAD District 1 (East Coast) crude oil stocks declined 0.6 million barrels, PADD 2 (Midwest) stocks fell 0.8 million barrels, PADD 4 (Rockies) stocks retreated 0.1 million barrels, and PADD 5 (West Coast) stocks decreased 0.3 million barrels, PAD District 3 (Gulf Coast) stocks rose 3.0 million barrels.
Cushing, Oklahoma inventories decreased 1.1 million barrels from the previous report week to 27.8 million barrels.
Domestic crude oil production was unchanged from the previous report week at 10.900 million barrels per day.
Crude oil imports averaged 9.055 million barrels per day, a daily increase of 699,000 barrels per day. Exports decreased 664,000 barrels daily to 2.336 million barrels per day.
Refineries used 97.1 per cent of capacity, a decrease of 0.4 percentage points from the previous report week.
Crude oil inputs to refineries decreased 163,000 barrels daily; there were 17.653 million barrels per day of crude oil run to facilities. Gross inputs, which include blending stocks, fell 73,000 barrels daily to 18.051 million barrels daily.
Total petroleum product inventories saw an increase of 2.1 million barrels from the previous report week.
Gasoline stocks decreased 1.5 million barrels from the previous report week; total stocks are 239.7 million barrels.
Demand for gasoline rose 137,000 barrels per day to 9.869 million barrels per day.
Total product demand increased 976,000 barrels daily to 21.272 million barrels per day.
Distillate fuel oil stocks increased 0.1 million barrels from the previous report week; distillate stocks are117.6 million barrels. National distillate demand was reported at 4.126 million barrels per day during the report week. This was a weekly increase of 514,000 barrels daily.
Propane stocks rose 2.9 million barrels from the previous report week; propane stock are 61.2 million barrels. Current demand is estimated at 824,000 barrels per day, a decrease of 3,000 barrels daily from the previous report week.
Natural Gas
Working gas in storage was 2,152 Bcf as of Friday, June 29, 2018, according to EIA estimates. This represents a net increase of 78 Bcf from the previous week. Stocks were 717 Bcf less than last year at this time and 493 Bcf below the five-year average of 2,645 Bcf. At 2,152 Bcf, total working gas is within the five-year historical range.
Futures trading involves significant risk and is not suitable for everyone. Transactions in securities futures, commodity and index futures and options on future markets carry a high degree of risk. The amount of initial margin is small relative to the value of the futures contract, meaning that transactions are heavily “leveraged”. A relatively small market movement will have a proportionately larger impact on the funds you have deposited or will have to deposit: this may work against you as well as for you. You may sustain a total loss of initial margin funds and any additional funds deposited with the clearing firm to maintain your position. If the market moves against your position or margin levels are increased, you may be called upon to pay substantial additional funds on short notice to maintain your position. If you fail to comply with a request for additional funds within the time prescribed, your position may be liquidated at a loss and you will be liable for any resulting deficit. Past performance may not be indicative of future results. This is not an offer to invest in any investment program.
Powerhouse is a registered affiliate of Coquest, Inc.
Was this helpful? We’d like your feedback.
Please respond to [email protected]
Copyright © 2018 Powerhouse, All rights reserved.