Gasoline Crack Spreads Looking For a Low
- Gas crack spreads typically bottom early in the year
- Gasoline demand above average
- Domestic crude oil production reaches ten million barrels per day
- Natural gas storage deficit to five-year average

The Matrix
The gasoline crack spread is a closely watched measure of refiners’ health. The spread is a rough estimate of refiner’s profit margins. It can also imply a lot about margins for gasoline retailers. Retailers’ margins tend to move inversely to those of refiners, especially in the first quarter.
The crack spread – the difference between the refiner’s cost of crude and the sales price of products – reflects how refiners react to the need to maintain equipment (refinery “turnaround”) and product demand. The crack spread in the futures market offsets crude oil contracts with equal numbers of gasoline and/or ULSD contracts. A buyer of the gasoline crack spread (the “gas crack”) sells crude oil contracts while buying the same number of RBOB contracts.
Typically, the gas crack reaches a low late in the fourth quarter, rallies through the first quarter, and after Memorial Day moves lower through the rest of the year. This pattern can be seen on the chart of the Gas Crack Index, showing the average weekly gas crack relative to average since 1995.
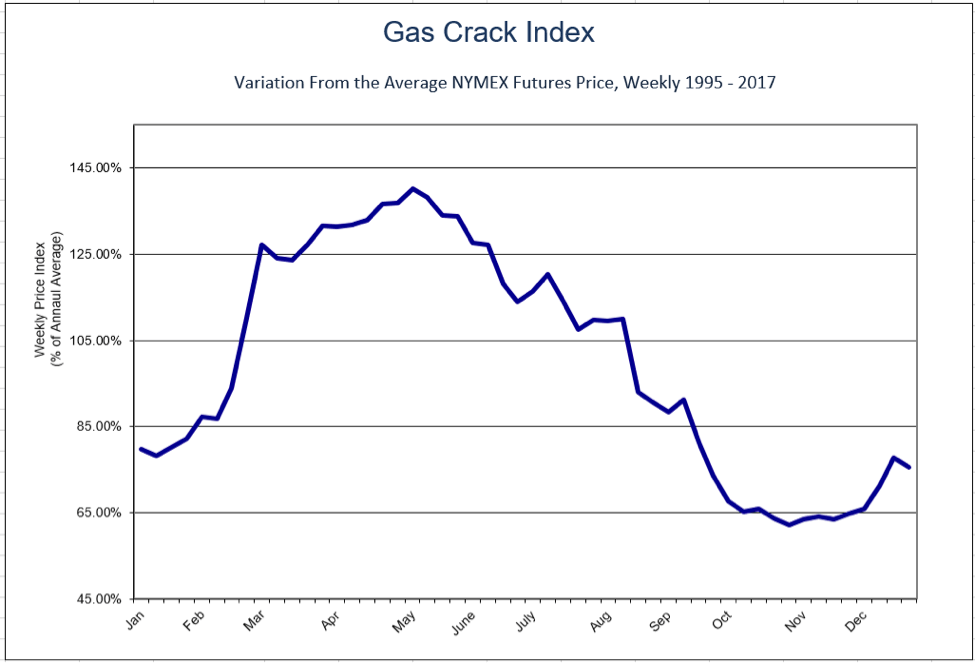
Price Chart: Average Gas Crack Prices 1995 to 2017
The gas crack market is now in the bottom of the annual range. Factors influencing growth in the gas crack include gasoline demand, crude oil supply and how intensely refineries are being operated.
Gasoline demand most recently reached 8.8 million barrels daily. EIA estimates this is 7.3 per cent higher than last year at this time. At the same time, U.S. monthly crude oil production has exceeded ten million barrels daily for the first time since 1970. The nation is closing in on an all-time high, supporting our aim of energy independence. In the short term, strong gasoline demand and plenty of crude oil available conduce to a stronger gas crack.
Another bullish consideration is the recent decline in refinery utilization. At year end, refineries were operating at 96.7 per cent of capacity. Four weeks later, use fell to 88.1 per cent. Crude oil inputs fell 1.6 million barrels daily at this time.
Supply/Demand Balances
Supply/demand data in the United States for the week ending January 26, 2018 were released by the Energy Information Administration.
Total commercial stocks of petroleum rose 2.1 million barrels during the week ending January 26, 2018.
Draws were reported in stocks of gasoline, fuel ethanol, distillates, propane, and other oils. Builds were reported in stocks of K-jet fuel and residual fuel oil.
Commercial crude oil supplies in the United States increased to 418.4 million barrels, a build of 6.8 million barrels.
Crude oil supplies increased in three of the five PAD Districts. PAD District 1 (East Coast) crude oil stocks rose 2.2 million barrels, PADD 3 (Gulf Coast) stocks grew 6.5 million barrels, and PADD 5 (West Coast) stocks advanced 2.2 million barrels. PADD 2 (Midwest) stocks fell 3.9 million barrels and PADD 4 (Rockies) stocks decreased 0.3 million barrels.
Cushing, Oklahoma inventories decreased 2.2 million barrels from the previous report week to 37.0 million barrels.
Domestic crude oil production increased 41,000 barrels daily to 9.919 million barrels per day from the previous report week.
Crude oil imports averaged 8.43 million barrels per day, a daily increase of 389,000 barrels. Exports rose 354,000 barrels daily to 1.765 million barrels per day.
Refineries used 88.1 per cent of capacity, a decrease of 2.8 percentage points from the previous report week.
Crude oil inputs to refineries decreased 470,000 barrels daily; there were 16.013 million barrels per day of crude oil run to facilities. Gross inputs, which include blending stocks, fell 515,000 barrels daily to 16.305 million barrels daily.
Total petroleum product inventories saw a decrease of 4.7 million barrels from the previous report week.
Gasoline stocks decreased 2.0 million barrels from the previous report week; total stocks are 242.1 million barrels.
Demand for gasoline increased 348,000 barrels per day to 9.044 million barrels daily.
Total product demand increased 367,000 barrels daily to 21.003 million barrels per day.
Distillate fuel oil supply fell 1.9 million barrels from the previous report week to 137.9 million barrels. National distillate demand was reported at 4.470 million barrels per day during the report week. This was a weekly increase of 623,000 barrels daily.
Propane stocks decreased 0.9 million barrels from the previous report week to 53.1 million barrels. Current demand is estimated at 1.530 million barrels per day, a decrease of 239,000 barrels daily from the previous report week.
Natural Gas
According to the Energy Information Administration:
Working gas deficit to the five-year average declined by 61 Bcf. Net withdrawals from storage totaled 99 Bcf for the week ending January 26, compared with the five-year (2013–17) average net withdrawal of 160 Bcf and last year’s net withdrawals of 92 Bcf during the same week. Working gas stocks totaled 2,197 Bcf, which is 425 Bcf less than the five-year average and 526 Bcf less than last year at this time.
Total U.S. consumption of natural gas fell by 2% compared with the previous report week, according to data from PointLogic Energy. Natural gas consumed for power generation declined by 8% week over week. Industrial sector consumption decreased by 1% week over week. In the residential and commercial sectors, consumption remained at last week’s level, averaging 37.8 Bcf/d.
At mid-December, spot natural gas futures bottomed at $2.566 Subsequent explosion of heating degree days was reflected in a rapid rise in natural gas futures, topping at $3.662 as the February futures neared termination. Consistent with a warmer trend, prices fell, retracing more than 62 per cent of the entire January rally.
Long-term support returns now to $2.57. This level of support is very important. This approximate level has been tested four times since mid-2016. A break invites tests of lower lows down as far as $1.61 (seen last in March, 2016.)
Futures trading involves significant risk and is not suitable for everyone. Transactions in securities futures, commodity and index futures and options on future markets carry a high degree of risk. The amount of initial margin is small relative to the value of the futures contract, meaning that transactions are heavily “leveraged”. A relatively small market movement will have a proportionately larger impact on the funds you have deposited or will have to deposit: this may work against you as well as for you. You may sustain a total loss of initial margin funds and any additional funds deposited with the clearing firm to maintain your position. If the market moves against your position or margin levels are increased, you may be called upon to pay substantial additional funds on short notice to maintain your position. If you fail to comply with a request for additional funds within the time prescribed, your position may be liquidated at a loss and you will be liable for any resulting deficit. Past performance may not be indicative of future results. This is not an offer to invest in any investment program.
Powerhouse is a registered affiliate of Coquest, Inc.
Was this helpful? We’d like your feedback.
Please respond to [email protected]
Copyright © 2018 Powerhouse, All rights reserved