Strong Demand Supports Petroleum Prices
- U.S. demand is eight per cent greater than last year
- Foreign oil production growth is stalling
- U.S. shale gains offsetting other losses
- Natural gas reserves for 2016 are 17 per cent higher than in 2015


The Matrix
The impact of a colder winter is fading as February reaches its midpoint. Nonetheless, U.S. demand for petroleum products continues at a high level. The most recent data from the Energy Information Administration puts daily demand at 20.3 million barrels. Last year, demand was 18.7 million barrels per day at this time.
Gasoline use is running 9.1 million barrels per day, 626,000 barrels higher than last year (+7.4%.) Distillate fuel oil demand is at 4.1 million barrels daily, (5.9 % more than during 2017 at this time.)
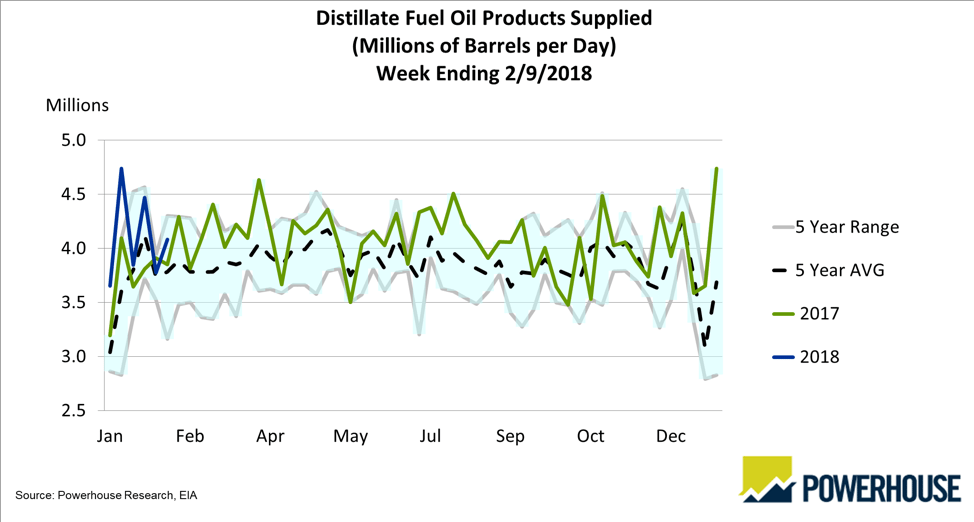
Product Supplied Chart: Weekly Distillate Products Supplied 5-Year Trend Chart
Strong demand is not the only determinant of price. The export trade is a significant destination for American supply. Total daily exports are 6.3 million barrels, of which crude oil constitutes 1.3 million barrels.
The introduction of American crude oil into global petroleum streams comes at a time when OPEC and other overseas producers are trying to determine how best to reduce supply and support prices. Some price support should come from reduced output of conventionally-produced crude oil. One analysis expects such supply to top in the next five years.
According to this research, non-OPEC supply declines are accelerating. The rate of decline reached 5.4 per cent in 2017. (In 2014, decline rates were 4.2 per cent.) New traditional projects may be enough to offset current decline rates, and may even provide some growth in places like Brazil, Russia and Norway. Many countries, however, are not adding new exploration/development projects. These include China and Ghana. The net of these gains and declines come to a small, about 70 thousand barrels daily gain through 2023.
This is where shale development in the United States makes a difference. Supply from shale-based oil is expected to grow by 4.2 million barrels daily through 2023. The growth rate is likely to slow to around 500,000 barrels daily at the end of that period. At the same time, demand could slow as well, allowing tight oil to satisfy demand through this period.
Supply/Demand Balances
Supply/demand data in the United States for the week ending February 9, 2018 were released by the Energy Information Administration.
Total commercial stocks of petroleum fell 2.7 million barrels during the week ending February 9, 2018.
Builds were reported in stocks of gasoline and K-jet fuel. There were draws stocks of fuel ethanol, distillates, residual fuel, propane, and other oils.
Commercial crude oil supplies in the United States increased to 422.1 million barrels, a build of 1.8 million barrels.
Crude oil supplies increased 6.1 million barrels in PAD District 3 (Gulf Coast). PAD District 1 (East Coast) crude oil stocks decreased 0.5 million barrels, PADD 2 (Midwest) crude stocks fell 3.1 million barrels, PADD 4 (Rockies) declined 0.4 million barrels, and PADD 5 (West Coast) retreated 0.3 million barrels.
Cushing, Oklahoma inventories decreased 3.6 million barrels from the previous report week to 32.7 million barrels.
Domestic crude oil production increased 20,000 barrels daily to 10.271 million barrels per day from the previous report week.
Crude oil imports averaged 7.888 million barrels per day, a daily decrease of 4,000 barrels. Exports rose 35,000 barrels daily to 1.322 million barrels per day.
Refineries used 89.8 per cent of capacity, a decrease of 2.7 percentage points from the previous report week.
Crude oil inputs to refineries decreased 635,000 barrels daily; there were 16.162 million barrels per day of crude oil run to facilities. Gross inputs, which include blending stocks, fell 496,000 barrels daily to 16.632 million barrels daily.
Total petroleum product inventories saw a decrease of 4.5 million barrels from the previous report week.
Gasoline stocks increased 3.6 million barrels from the previous report week; total stocks are 249.1 million barrels.
Demand for gasoline decreased 51,000 barrels per day to 9.059 million barrels daily.
Total product demand decreased 559,000 barrels daily to 20.284 million barrels per day.
Distillate fuel oil supply fell 0.5 million barrels from the previous report week to 141.4 million barrels. National distillate demand was reported at 4.082 million barrels per day during the report week. This was a weekly increase of 303,000 barrels daily.
Propane stocks decreased 3.3 million barrels from the previous report week to 45.6 million barrels. Current demand is estimated at 1.540 million barrels per day, a decrease of 467,000 barrels daily from the previous report week.
Natural Gas
According to the Energy Information Administration:
Net withdrawals from storage totaled 194 Bcf for the week ending February 9, compared with the five-year (2013–17) average net withdrawal of 154 Bcf and last year’s net withdrawals of 120 Bcf during the same week. Working gas stocks totaled 1,884 Bcf, which is 433 Bcf less than the five-year average and 577 Bcf less than last year at this time. All regions in the Lower 48 states except for the Pacific region are lower than year-ago levels.
If net withdrawals from working gas stocks match the five-year average for the remainder of the withdrawal season, working gas stocks will total 1,269 Bcf by March 31, 2018, which is 25% lower than the five-year average, and the second lowest end-of-heating-season level reported since 2010. Working gas stocks ended the 2013–14 heating season at 837 Bcf, which is the lowest reported level during that period.
EIA has released estimated proved reserves of U.S. natural gas for 2016. The country had 341.1 Tcf of proved reserves at that time. This represented a five per cent increase over 2015. Moreover, the gain compared to a 17 per cent drop in 2015. The largest net increase was experienced in Pennsylvania where the Marcellus Shale play added 6.1 Tcf to reserves.
Proved reserves are those volumes of natural gas that are recoverable in future years from known reservoirs under existing economic and operating conditions.
Futures trading involves significant risk and is not suitable for everyone. Transactions in securities futures, commodity and index futures and options on future markets carry a high degree of risk. The amount of initial margin is small relative to the value of the futures contract, meaning that transactions are heavily “leveraged”. A relatively small market movement will have a proportionately larger impact on the funds you have deposited or will have to deposit: this may work against you as well as for you. You may sustain a total loss of initial margin funds and any additional funds deposited with the clearing firm to maintain your position. If the market moves against your position or margin levels are increased, you may be called upon to pay substantial additional funds on short notice to maintain your position. If you fail to comply with a request for additional funds within the time prescribed, your position may be liquidated at a loss and you will be liable for any resulting deficit. Past performance may not be indicative of future results. This is not an offer to invest in any investment program.
Powerhouse is a registered affiliate of Coquest, Inc.
Was this helpful? We’d like your feedback.
Please respond to [email protected]
Copyright © 2018 Powerhouse, All rights reserved.