WTI Crude Oil Breaks $60 Support
- U.S. oil production confirmed greater than 10 million barrels daily
- Product stocks up in preparation for refinery turnaround
- Technical support being challenged
- Natural gas storage deficit to 5-year average shrinks


The Matrix
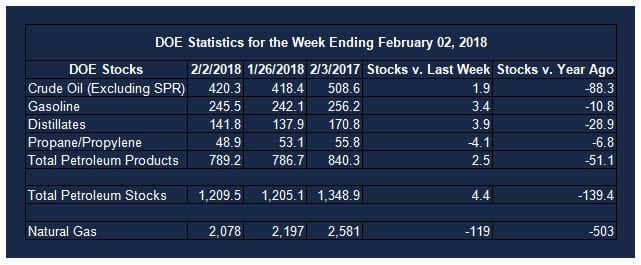
Energy prices reacted negatively to a large set of bearish numbers issued by the Energy Information Administration for the week ending February 2, 2018. Weekly crude oil production data confirmed output in excess of 10 million barrels daily.

Production Chart: Monthly Crude Oil Production Jan 1920 – Nov 2017
According to the EIA, this “is the first time since 1970 that monthly U.S. production levels surpassed 10 million b/d and the second-highest U.S. monthly oil production value ever, just below the November 1970 production value of 10.044 million b/d.” Other bearish data included growth of inventories of gasoline (+ 3.4 million barrels) and distillate fuel oil (+ 3.9 million barrels.)
Markets are anticipating the onset of spring turnaround, and indeed, the prior weekly EIA report showed a sharp drop in refinery use. Data for February 2, however, reversed that decline, showing a 4.4 percentage point increase in use. This worked out to a gain of 784,000 barrels-daily crude oil input to refining.
These data led a broad decrease in oil prices. WTI support at $59 was challenged in response to these data. Distillate fuel oil support at $1.8550 and RBOB support at $1.6410 are in play.
Not every oil statistic is bearish. Crude oil exports continue to expand the global reach of the United States. The U.S. is now regularly exporting more than one million barrels of crude oil daily. Cargos are moving to many foreign ports heretofore served largely by OPEC producers.
One particular transaction highlights the changing role of the U.S. in global supply with a overlay of international diplomacy. Until recently, the United Arab Emirates bought its light crude oil (condensates) from Qatar. A dispute between these parties has the UAE looking elsewhere for supply. It found it in the United States. Government data shows the U.S. sent 700,000 barrels of light crude to the UAE in December. And while such a transaction is unlikely to become routine, it shows the geopolitical opportunities now possible in a market allowing for unconstrained international movement of oil.
Supply/Demand Balances
Supply/demand data in the United States for the week ending February 2, 2018 were released by the Energy Information Administration.
Total commercial stocks of petroleum rose 4.4 million barrels during the week ending February 2, 2018.
Builds were reported in stocks of gasoline, fuel ethanol, K-jet fuel, distillates, and residual fuel oil. There were draws stocks of propane and other oils.
Commercial crude oil supplies in the United States increased to 420.3 million barrels, a build of 1.9 million barrels.
Crude oil supplies increased 4.8 million barrels in PAD District 3 (Gulf Coast). PAD District 1 (East Coast) crude oil stocks decreased 0.2 million barrels, PADD 2 (Midwest) crude stocks fell 0.1 million barrels, PADD 4 (Rockies) declined 0.3 million barrels, and PADD 5 (West Coast) retreated 2.2 million barrels.
Cushing, Oklahoma inventories decreased 0.7 million barrels from the previous report week to 36.3 million barrels.
Domestic crude oil production increased 332,000 barrels daily to 10.251 million barrels per day from the previous report week.
Crude oil imports averaged 7.892 million barrels per day, a daily decrease of 538,000 barrels. Exports fell 478,000 barrels daily to 1.287 million barrels per day.
Refineries used 92.5 per cent of capacity, an increase of 4.4 percentage points from the previous report week.
Crude oil inputs to refineries increased 784,000 barrels daily; there were 16.797 million barrels per day of crude oil run to facilities. Gross inputs, which include blending stocks, rose 823,000 barrels daily to 17.128 million barrels daily.
Total petroleum product inventories saw an increase of 2.5 million barrels from the previous report week.
Gasoline stocks increased 3.4 million barrels from the previous report week; total stocks are 245.5 million barrels.
Demand for gasoline increased 66,000 barrels per day to 9.110 million barrels daily.
Total product demand decreased 160,000 barrels daily to 20.843 million barrels per day.
Distillate fuel oil supply rose 3.9 million barrels from the previous report week to 141.8 million barrels. National distillate demand was reported at 3.778 million barrels per day during the report week. This was a weekly decrease of 692,000 barrels daily.
Propane stocks decreased 4.1 million barrels from the previous report week to 48.9 million barrels. Current demand is estimated at 2.007 million barrels per day, an increase of 477,000 barrels daily from the previous report week.
Natural Gas
According to the Energy Information Administration:
Working gas deficit to the five-year average declined 32 Bcf Net withdrawals from storage totaled 119 Bcf for the week ending February 2, compared with the five-year (2013–17) average net withdrawal of 151 Bcf and last year’s net withdrawal of 142 Bcf during the same report week. Working gas stocks totaled 2,078 Bcf, which is 393 Bcf less than the five-year average and 503 Bcf less than last year at this time .
Natural gas futures are challenging support at $2.56. Next support is around $2.20.

Price Chart: Natural Gas Spot Futures Sep 2015 – Feb 2018
Futures trading involves significant risk and is not suitable for everyone. Transactions in securities futures, commodity and index futures and options on future markets carry a high degree of risk. The amount of initial margin is small relative to the value of the futures contract, meaning that transactions are heavily “leveraged”. A relatively small market movement will have a proportionately larger impact on the funds you have deposited or will have to deposit: this may work against you as well as for you. You may sustain a total loss of initial margin funds and any additional funds deposited with the clearing firm to maintain your position. If the market moves against your position or margin levels are increased, you may be called upon to pay substantial additional funds on short notice to maintain your position. If you fail to comply with a request for additional funds within the time prescribed, your position may be liquidated at a loss and you will be liable for any resulting deficit. Past performance may not be indicative of future results. This is not an offer to invest in any investment program.
Powerhouse is a registered affiliate of Coquest, Inc.
Was this helpful? We’d like your feedback.
Please respond to [email protected]
Copyright © 2018 Powerhouse, All rights reserved.