Falling Global Crude Oil Supply Supports Price
- Venezuelan production below 1.5 million barrels daily
- Russia taking larger role in decisions allocating crude production ex U.S.
- U.S. adds more than 17 million barrels of petroleum to national supply
- Natural gas injections lag historical averages.


The Matrix
The laws of economics remind us that “them what has, gets.” Put another way for the petroleum trades, more production yields more clout in decision making. And the current focus on discussions between Saudi Arabia and Russia highlights a situation in the oil production world that was unimaginable just a few years ago.
Saudi Arabia has been the de facto leader of OPEC since the mid-1970’s when its production began outdistancing output in Iran and Venezuela. It is ironic that Iran now faces imposition of sanctions that could take up to one and one-half million barrels of crude oil from global trade. Internal instability in Venezuela has led to the virtual collapse of its production, now below 1.5 million barrels. Many analysts expect output to fall even further. Considerations like these failures of production are principal reasons for concerns about crude oil availability.
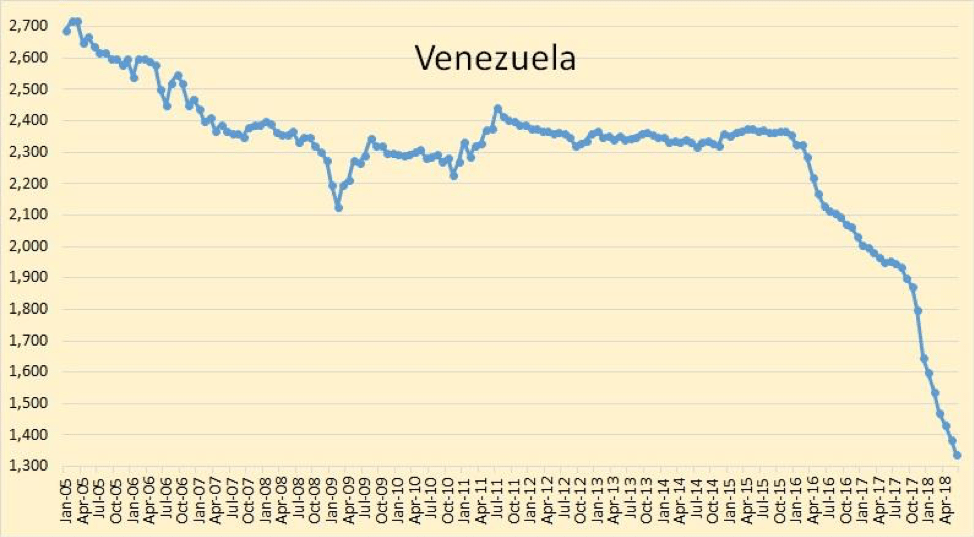
Monthly Oil Production, Venezuela Jan. 2005 – Apr. 2018
Kuwait and the United Arab Emirates reportedly have some expansion capacity. Other OPEC members produce at will, reflecting their large current needs for revenue.
Saudi Arabia’s unchallenged leadership in OPEC allows the Kingdom to seek cooperation with non-OPEC producers. Russia is first among those. Both Saudi Arabia and Russia began raising output even before a formal decision to expand output was taken by OPEC late in June.
The historical approach taken by OPEC watchers is changing. It is no longer enough to keep one’s eye on Saudi Arabia. The role of Russia has expanded and needs to be considered. (Moreover, the United States has expressed its views which have a strong political component. Its role in Iranian sanctions is one example.)
Practical Fuel Hedging
Learn strategies to grow your business and manage risk.
The St. Jane, Chicago IL, November 15-16, 2018
Register Today and Save $200 >>
Supply/Demand Balances
Supply/demand data in the United States for the week ending August 10, 2018 were released by the Energy Information Administration.
Total commercial stocks of petroleum rose 17.4 million barrels during the week ending August 10, 2018.
There were builds in stocks of fuel ethanol, kerojet, distillate fuel oil, residual fuel oil, propane, and other oils. There were draws in stocks of gasoline.
Commercial crude oil supplies in the United States increased to 414.2 million barrels, a build of 6.8 million barrels.
Crude oil supplies increased in four of the five PAD Districts. PAD District 1 (East Coast) crude oil stocks grew 2.1 million barrels, PADD 2 (Midwest) crude stocks gained 1.6 million barrels, PADD 3 (Gulf Coast) stocks added 0.4 million barrels. PAD District 4 (Rockies) stocks were unchanged and PADD 5 (West Coast) stocks increased 2.6 million barrels.
Cushing, Oklahoma inventories increased 1.6 million barrels from the previous report week to 23.4million barrels.
Domestic crude oil production added 100,000 barrels per day in the last report week to 10.900 million barrels per day.
Crude oil imports averaged 9.014 million barrels per day, a daily increase of 1,083,000 barrels per day. Exports decreased 258,000 barrels daily to 1.592 million barrels per day.
Refineries used 98.1per cent of capacity, an increase of 1.5 percentage points from the previous report week.
Crude oil inputs to refineries increased 383,000 barrels daily; there were 18.000 million barrels per day of crude oil run to facilities. Gross inputs, which include blending stocks, rose 270,000 barrels daily to 18.243 million barrels daily.
Total petroleum product inventories saw an increase of 10.6 million barrels from the previous report week.
Gasoline stocks decreased 0.7 million barrels from the previous report week; total stocks are 233.1 million barrels.
Demand for gasoline increased 166,000 barrels per day to 9.512 million barrels per day.
Total product demand decreased 741,000 barrels daily to 20.187 million barrels per day.
Distillate fuel oil stocks increased 3.6 million barrels from the previous report week; distillate stocks are 129.0 million barrels. National distillate demand was reported at 4.000 million barrels per day during the report week. This was a weekly decrease of 44,000 barrels daily.
Propane stocks rose 3.4 million barrels from the previous report week; propane stock are 69.8 million barrels. Current demand is estimated at 1.593 million barrels per day, a decrease of 471,000 barrels daily from the previous report week.
Natural Gas
According to the Energy Information Administration:
Net injections are lower than the five-year average for the seventh week in a row. Net injections into storage totaled 33 Bcf for the week ending August 10, compared with the five-year (2013–17) average net injections of 56 Bcf and last year’s net injections of 49 Bcf during the same week. Working gas stocks totaled 2,387 Bcf, which is 595 Bcf lower than the five-year average and 687 Bcf lower than last year at this time.
Working gas stocks are lower than the five-year range for the second week in a row. The average rate of net injections into storage is 19% lower than the five-year average so far in the 2018 refill season. If working gas stocks match the five-year average rate of injections of 10.1 Bcf/d for the remainder of the refill season, inventories will total 3,220 Bcf on October 31, which is 340 Bcf lower than the five-year low of 3,560 Bcf. In the Lower 48 states, total working gas are currently 24 Bcf lower than the five-year range in the East region and 70 Bcf lower than the five-year range in the Midwest.
Futures trading involves significant risk and is not suitable for everyone. Transactions in securities futures, commodity and index futures and options on future markets carry a high degree of risk. The amount of initial margin is small relative to the value of the futures contract, meaning that transactions are heavily “leveraged”. A relatively small market movement will have a proportionately larger impact on the funds you have deposited or will have to deposit: this may work against you as well as for you. You may sustain a total loss of initial margin funds and any additional funds deposited with the clearing firm to maintain your position. If the market moves against your position or margin levels are increased, you may be called upon to pay substantial additional funds on short notice to maintain your position. If you fail to comply with a request for additional funds within the time prescribed, your position may be liquidated at a loss and you will be liable for any resulting deficit. Past performance may not be indicative of future results. This is not an offer to invest in any investment program.
Powerhouse is a registered affiliate of Coquest, Inc.
Was this helpful? We’d like your feedback.
Please respond to [email protected]
Copyright © 2018 Powerhouse, All rights reserved.