Crude Oil Rally Losing its Luster?
- Dueling U.S./China tariffs raise uncertainty on price direction
- Expanding uses for distillates still support price
- U.S. crude oil production softening
- Inadequate pipelining limits availability of West Texas crudes
- Natural gas injection fails 5-year average

The Matrix
The imposition of tariffs by the United States and counters by China may be imposing some constraint on oil pricing. After a run that began in February, 2016 from a low at $26.05, crude oil prices rallied into July. Prices rallied to a top at $75.27 on July 6, 2018. The move reflected concerns that oil supply might be insufficient to meet burgeoning global demand. The 2020 imposition of low sulfur fuel oil requirements on maritime users has been a particular concern.
The reduction in WTI crude oil prices since early July is not a repudiation of supply concerns. It is more likely a reaction to intensifying trade war actions which could inhibit economic activity in the months ahead. Moreover, Saudi Arabia has recently adopted a more bearish stance on production. Along with Russia and others, Saudi’s expanding output is meant in part to offset crude oil losses from Venezuela, Libya and others.
The outlook for production in the United States is starting to soften. Earlier this year, the outlook for new domestic production was unabashedly optimistic. The Energy Information Administration has recently lowered its estimate of 2019 U.S. production by 100,000 barrels per day to 11.7 million barrels daily. This reflects flat drilling since late June and the oil rig count has started to move lower. Inadequate pipeline availability, especially in the Permian basin, adds to a more cautious tone among production analysts.
This supply concern is bullish for price. As recently as last week, (Weekly Energy Situation, August 6, 2018,) Powerhouse reported on a survey of analysts that has “shown higher oil prices in each of the past ten consecutive months.” Over the longer term,
another analyst gave an expectations reaching as high as $160.
Trader uncertainty is controlling price. Crude oil prices fell to $67 by mid-July Since then, crude oil has traded in a narrow range.
Supply/Demand Balances
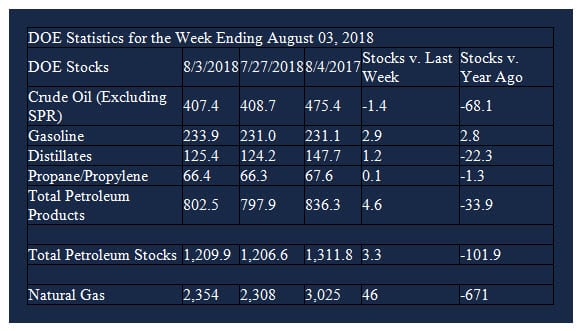
Supply/demand data in the United States for the week ending August, 03 2018 were released by the Energy Information Administration.
Total commercial stocks of petroleum rose 3.3 million barrels during the week ending August 03, 2018.
There were builds in stocks of gasoline, fuel ethanol, distillate fuel oil, propane, and other oils. There were draws in stocks of gasoline and residual fuel.
Commercial crude oil supplies in the United States decreased to 407.4 million barrels, a draw of 1.4 million barrels.
Crude oil supplies decreased in three of the five PAD Districts. PAD District 1 (East Coast) crude oil stocks fell 1.0 million barrels, PADD 2 (Midwest) crude stocks declined 0.3 million barrels, and PADD 3 (Gulf Coast) stocks retreated 0.8 million barrels. PAD District 4 (Rockies) stocks rose 0.5 million barrels and PADD 5 (West Coast) stocks increased 0.3 million barrels.
Cushing, Oklahoma inventories decreased 0.6 million barrels from the previous report week to 21.8 million barrels.
Domestic crude oil production fell 100,000 barrels per day in the last report week to 10.800 million barrels per day.
Crude oil imports averaged 7.931 million barrels per day, a daily increase of 182,000 barrels per day. Exports increased 540,000 barrels daily to 1.850 million barrels per day.
Refineries used 96.6 per cent of capacity, an increase of 0.5 percentage points from the previous report week.
Crude oil inputs to refineries increased 118,000 barrels daily; there were 17.598 million barrels per day of crude oil run to facilities. Gross inputs, which include blending stocks, rose 93,000 barrels daily to 17.973 million barrels daily.
Total petroleum product inventories saw an increase of 4.7 million barrels from the previous report week.
Gasoline stocks increased 2.9 million barrels from the previous report week; total stocks are 233.9 million barrels.
Demand for gasoline decreased 532,000 barrels per day to 9.346 million barrels per day.
Total product demand increased 358,000 barrels daily to 20.928 million barrels per day.
Distillate fuel oil stocks increased 1.2 million barrels from the previous report week; distillate stocks are 125.4 million barrels. National distillate demand was reported at 4.002 million barrels per day during the report week. This was a weekly increase of 391,000 barrels daily.
Propane stocks rose 0.1 million barrels from the previous report week; propane stock are 66.4 million barrels. Current demand is estimated at 1.064 million barrels per day, an increase of 506,000 barrels daily from the previous report week.
Natural Gas
According to the Energy Information Administration:
Net injections are lower than the five-year average for the sixth week in a row. Net injections into storage totaled 46 Bcf for the week ending August 3, compared with the five-year (2013–17) average net injections of 53 Bcf and last year’s net injections of 29 Bcf during the same week. Working gas stocks totaled 2,354 Bcf, which is 572 Bcf lower than the five-year average and 671 Bcf lower than last year at this time.
Working gas stocks are below the five-year range for the second week in a row. The average rate of net injections into storage is 18% lower than the five-year average so far in the 2018 refill season. If working gas stocks match the five-year average rate of injections of 10.0 Bcf/d for the remainder of the refill season, inventories will total 3,243 Bcf on October 31, which is 317 Bcf lower than the five-year low of 3,560 Bcf.
Futures trading involves significant risk and is not suitable for everyone. Transactions in securities futures, commodity and index futures and options on future markets carry a high degree of risk. The amount of initial margin is small relative to the value of the futures contract, meaning that transactions are heavily “leveraged”. A relatively small market movement will have a proportionately larger impact on the funds you have deposited or will have to deposit: this may work against you as well as for you. You may sustain a total loss of initial margin funds and any additional funds deposited with the clearing firm to maintain your position. If the market moves against your position or margin levels are increased, you may be called upon to pay substantial additional funds on short notice to maintain your position. If you fail to comply with a request for additional funds within the time prescribed, your position may be liquidated at a loss and you will be liable for any resulting deficit. Past performance may not be indicative of future results. This is not an offer to invest in any investment program.
Powerhouse is a registered affiliate of Coquest, Inc.
Was this helpful? We’d like your feedback.
Please respond to [email protected]
Copyright © 2018 Powerhouse, All rights reserved.