
Release Date: March 6, 2018
Forecast Highlights
Global Liquid Fuels
- North Sea Brent crude oil spot prices averaged $65 per barrel (b) in February, a decrease of $4/b from the January level and the first month-over-month average decrease since June 2017. EIA forecasts Brent spot prices will average about $62/b in both 2018 and 2019 compared with an average of $54/b in 2017.
- EIA expects West Texas Intermediate (WTI) crude oil prices to average $4/b lower than Brent prices in both 2018 and 2019. NYMEX WTI contract values for May 2018 delivery traded during the five-day period ending March 1, 2018, suggest a range of $51/b to $76/b encompasses the market expectation for June 2018 WTI prices at the 95% confidence level.
- EIA estimates that U.S. crude oil production averaged 10.3 million barrels per day (b/d) in February, up 230,000 b/d from the January level, when there were some well freeze-offs in the Permian and Bakken. EIA has reported that total U.S. crude oil production averaged 9.3 million b/d in 2017, ending the year with production of 9.9 million b/d in December. EIA projects that U.S. crude oil production will average 10.7 million b/d in 2018, which would mark the highest annual average U.S. crude oil production level, surpassing the previous record of 9.6 million b/d set in 1970. EIA forecasts that 2019 crude oil production will average 11.3 million b/d.
- EIA estimates that inventories of global petroleum and other liquid fuels declined by 0.6 million b/d in 2017. In this forecast, global inventories grow by about 0.4 million b/d in 2018 and by another 0.3 million b/d in 2019.
Gasoline prices: The front-month futures price of reformulated blendstock for oxygenate blending (RBOB, the petroleum component of gasoline used in many parts of the country) declined 25 cents per gallon (gal) from June 1 to July 7, settling at $1.36/gal. The RBOB-Brent crack spread fell by 17 cents/gal over the same period, settling at 26 cents/gal. Even as gasoline consumption plus exports in May and June set back-to-back record highs of 10.1 million b/d, the average RBOB-Brent crack spread from May to June declined by 8 cents/gal to 37 cents/gal, the lowest for June since 2013. The decline in the RBOB crack spread reflects a gasoline market that continues to be well supplied despite rising gasoline demand. Because refineries increased gasoline yields over the past year, gasoline production has consistently set new five-year highs so far in 2016. Gasoline production in June was the second-highest on record for any month at 10 million b/d and is likely putting downward pressure on gasoline prices.

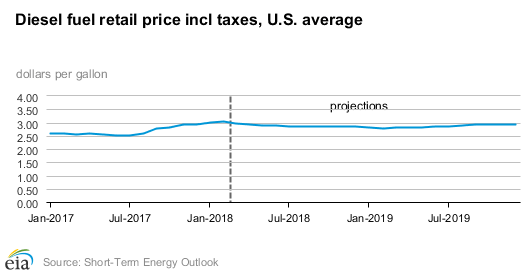
Ultra-low Sulfur Diesel Prices: The front-month futures price for the New York Harbor Ultra-low Sulfur Diesel (ULSD) contract declined 8 cents/gal from June 1 to settle at $1.41/gal on July 7. The ULSD-Brent crack spread declined 1 cent/gal over the same period to settle at 31 cents/gal.
ULSD prices generally followed crude oil prices in June, as shown by a nearly stable ULSD crack spread. In recent months, distillate consumption plus exports have recovered from the lows earlier this year and are now in line with last year’s levels. Some of the increase in domestic distillate consumption may be because of increasing activity in the U.S. manufacturing sector. The Institute for Supply Management’s manufacturing purchasing managers’ index rose to 53.2 in June, the fastest rate of expansion in U.S. manufacturing activity since February 2015. However, ULSD prices and crack spreads will likely continue to be weighed down by high distillate inventory levels, which remain 5 million barrels above the five-year high.

Natural Gas
- EIA estimates that U.S. dry natural gas production averaged 73.6 billion cubic feet per day (Bcf/d) in 2017. EIA forecasts that natural gas production will average 81.7 Bcf/d in 2018, establishing a new record. That level would be 8.1 Bcf/d higher than the 2017 level and the highest annual average growth on record. EIA expects natural gas production will also increase in 2019, with forecast growth of 1.0 Bcf/d.
- In February, the U.S. benchmark Henry Hub natural gas spot price averaged $2.66 per million British thermal units (MMBtu), down $1.03/MMBtu from January. Winter weather moderated in February after extremely cold temperatures in much of the country during the first half of January. U.S. heating degree days were an estimated 17% lower than the 10-year average for February, which contributed to lower consumption and prices.
- EIA expects natural gas prices to moderate in the coming months, based on a forecast of record natural gas production levels. EIA expects Henry Hub spot prices to average $2.72/MMBtu in March and $2.99/MMBtu for all of 2018. In 2019, EIA forecasts prices will average $3.07/MMBtu. NYMEX contract values for June 2018 delivery that traded during the five-day period ending March 1, 2018, suggest that a range of $2.16/MMBtu to $3.49/MMBtu encompasses the market expectation for June Henry Hub natural gas prices at the 95% confidence level.